BinoView Sequence Screener: How to Find Candle Streaks Across All Pocket Option Assets
Overview of the free sequence screener in BinoView: a real-time feed of same-colour candle streaks across all assets, signal strength stars, filters by market, direction, strength and streak length, M1 and M5 timeframes, and the Series Context panel with RSI, Stochastic, Bollinger and levels. How to open a trade straight from the screener, plus the USD/CAD trade from the video.
Contents
BinoView has a third tool next to Supercharts and the bots: the sequence screener. It scans all Pocket Option assets by itself and shows where a streak of same-colour candles is running right now. Below we walk through the interface top to bottom, the filters, the context panel, and open a trade on a USD/CAD streak as in the video.
What the screener does
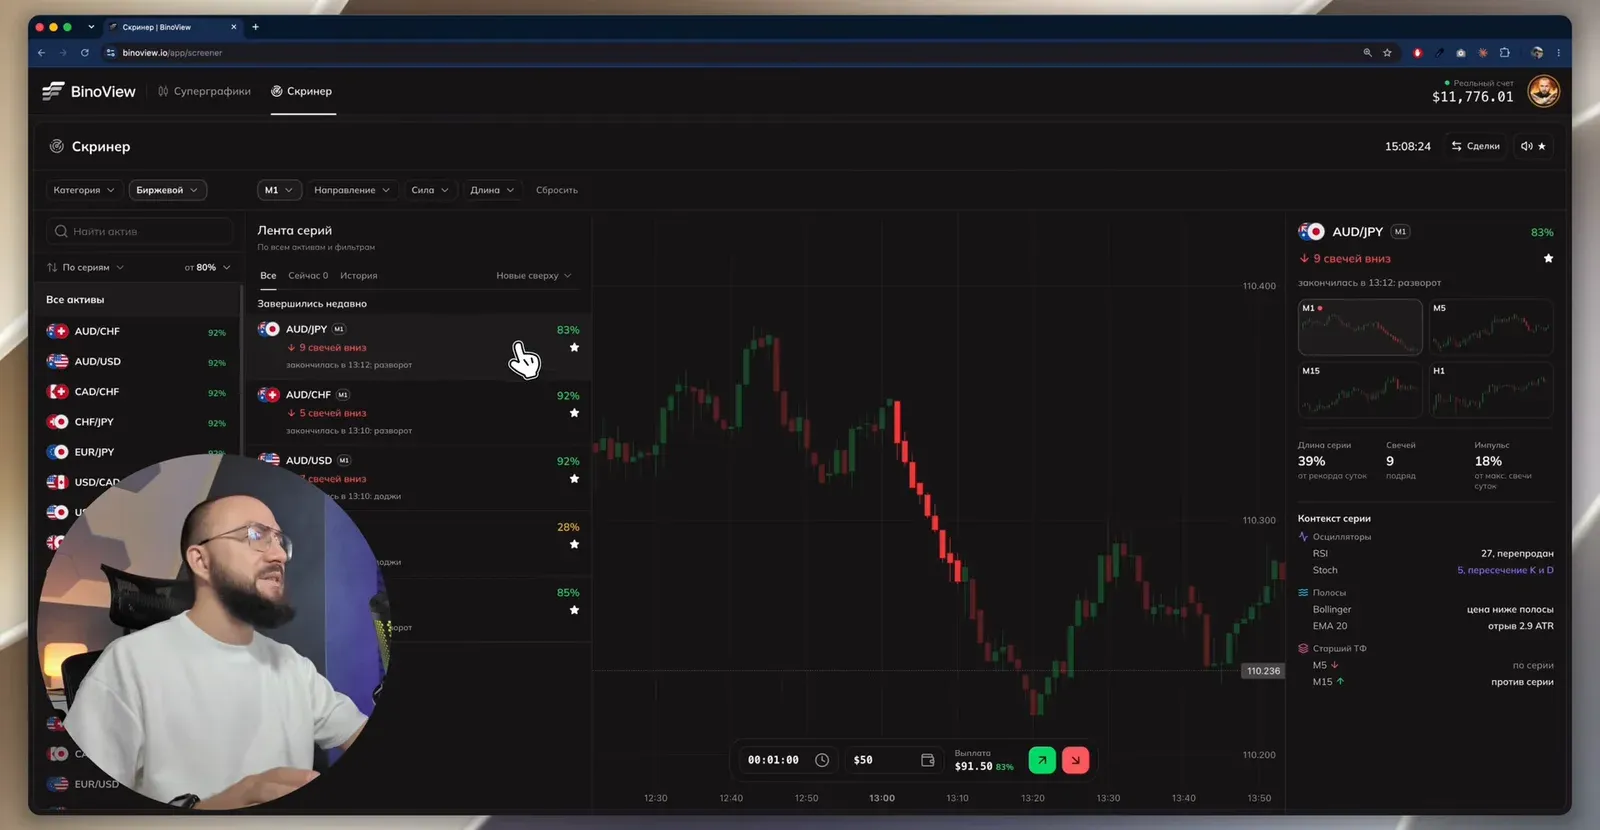
The screener is a separate tab in the BinoView header next to Supercharts. It analyses all of the broker's assets in real time and looks for sequences: several candles of the same colour in a row. Eight green candles on UAH/USD, nine red on AUD/JPY, four down on USD/CAD: all of it lands in the feed with a note on whether the streak has ended or is running right now.
It is important to understand the purpose. A streak is not a signal that "must" play out, but a situation for your strategy. After nine candles in one direction you can look for a reversal, or enter for continuation with the trend. The screener saves the search time; the decision stays with you.
The screener and Supercharts work independently and at the same time: a bot runs in Auto mode in the terminal while you look for situations by hand in the screener tab. Trades, history and balance are shared.
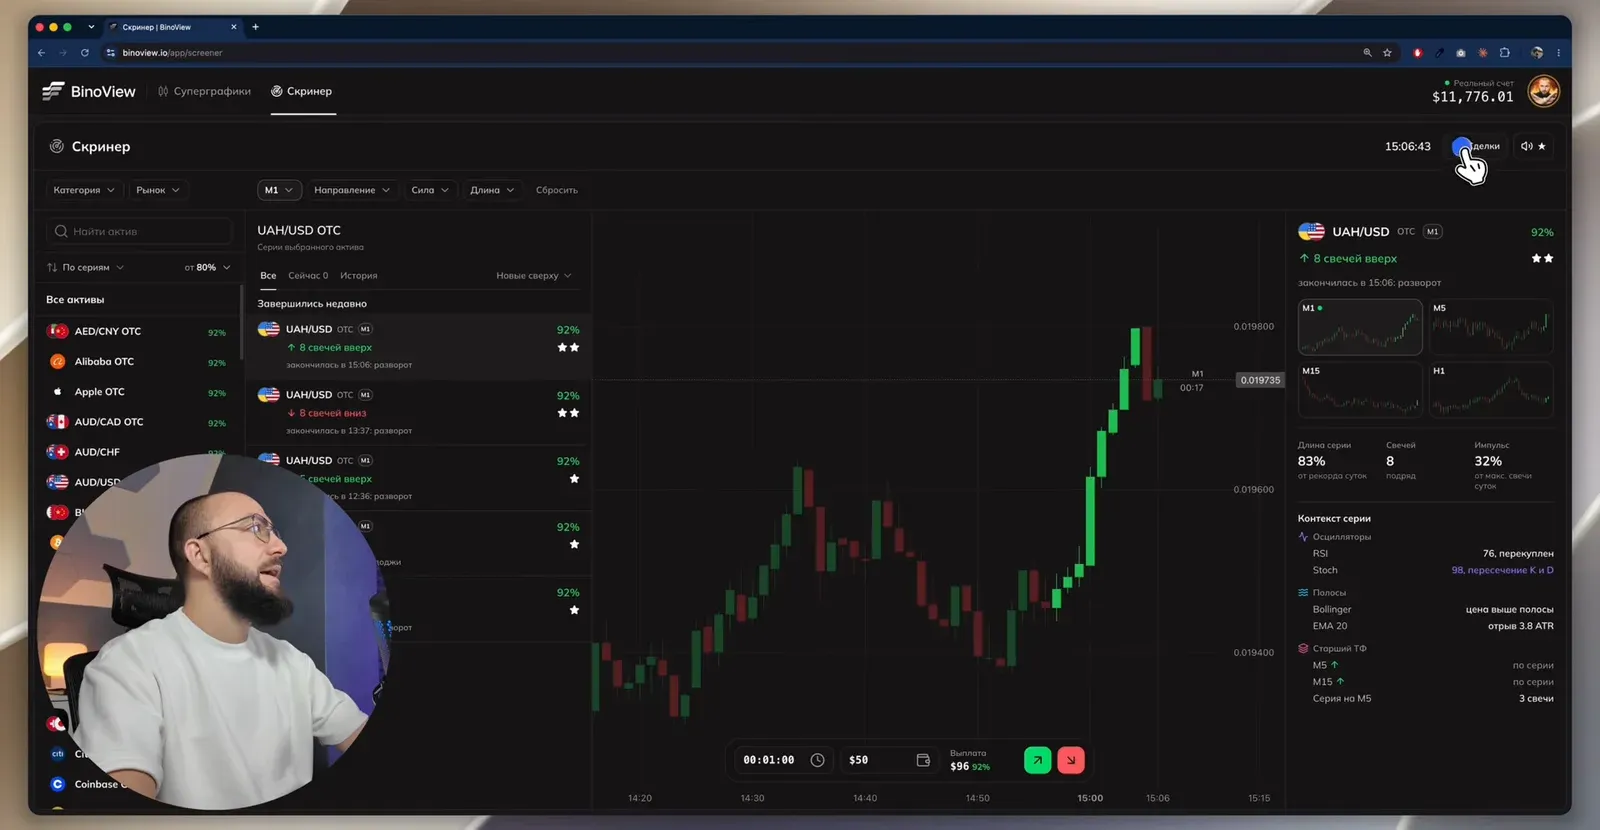
The interface top to bottom
- Time. The current time with seconds, to track the candle close.
- Trades. A switch between open and closed trades, the same list as in the terminal.
- Notifications. A bell with a threshold: from one, two or three stars, or off. Set it from two stars so that not every streak distracts you.
- Favourites. The star next to the bell pins an asset.
- Asset list on the left with payouts. Search by name: type "aud" and only the Australian dollar pairs remain. Sort "By streaks", "By strength" or "By name", plus a payout threshold of "from 80%" or "from 84%".
- Series feed in the centre. Tabs "All", "Now" (streaks running this minute) and "History" (about a day back, nothing deeper to avoid clutter). Sort "Newest first" or "Strongest first". At the bottom of the feed a separate block "Payout below 84%": such streaks are still visible but dimmed.
- Chart of the selected asset with the trade panel beneath it.
- Context panel on the right.
Strength stars
Every streak has one, two or three stars. Strength is calculated from two parameters: how many candles in a row and the impulse, that is how much larger the candles are than usual for this asset over the last day. If there has been no such move in this direction for a while, the streak gets more stars. The panel on the right shows it in numbers: "Streak length 83% of the day's record", "8 candles in a row", "Impulse 32% of the day's largest candle".
Sequence Screener and other tools — in BinoView Supercharts
Filters
The filters sit above the feed; they can be combined and reset with one button.
| Filter | Options | Why |
|---|---|---|
| Category | currencies, crypto, other categories, all | search only familiar assets |
| Market | exchange, OTC, all | the exchange market has no OTC streaks and vice versa |
| Timeframe | M1, M5 | which chart to search for streaks on |
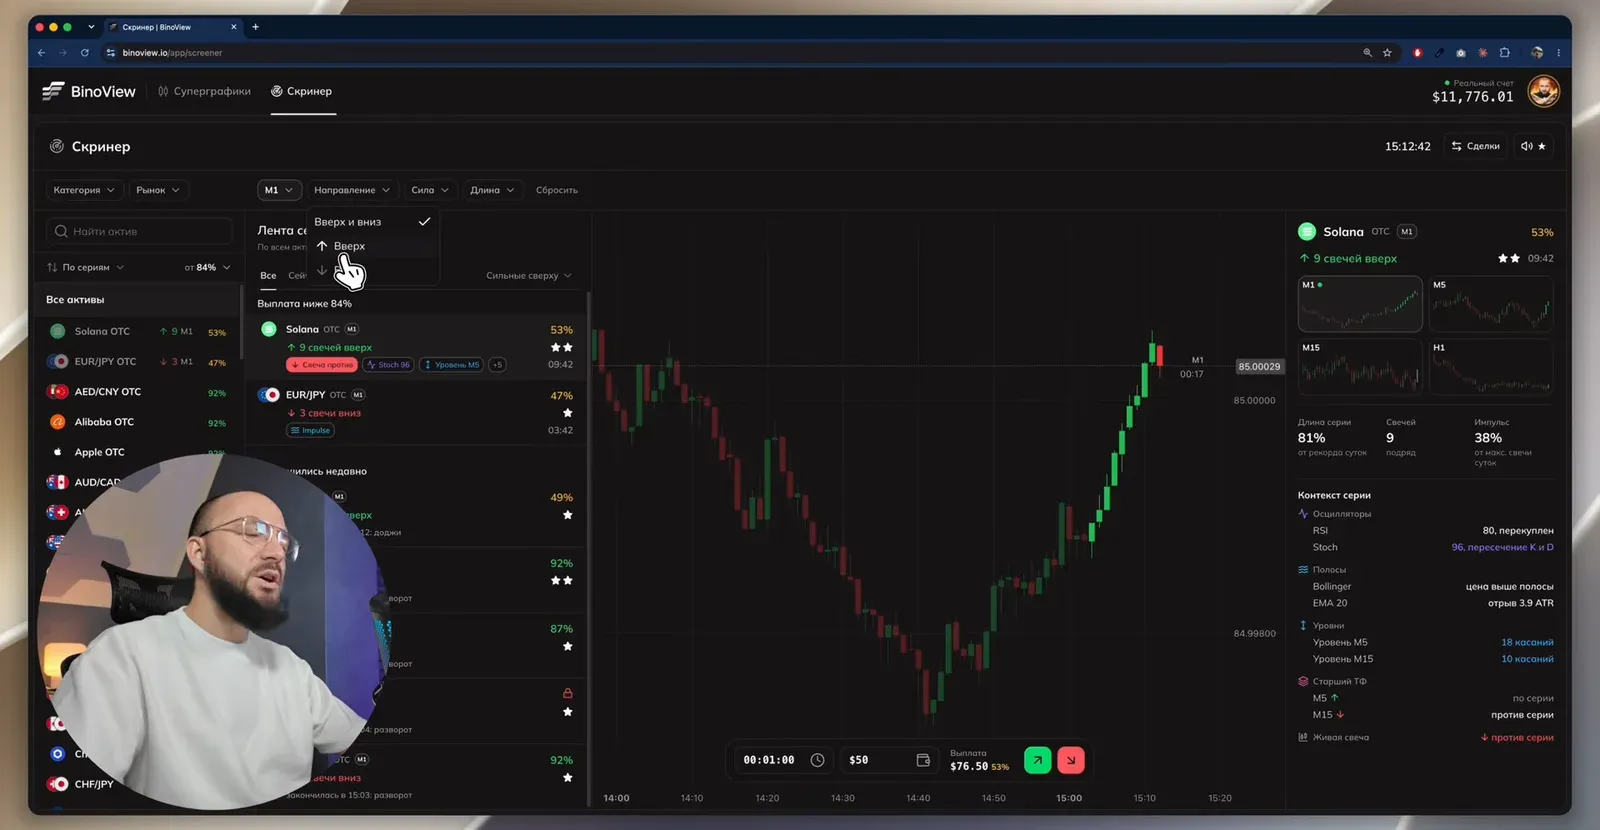
| Direction | up and down, up only, down only | for a reversal or a trend strategy |
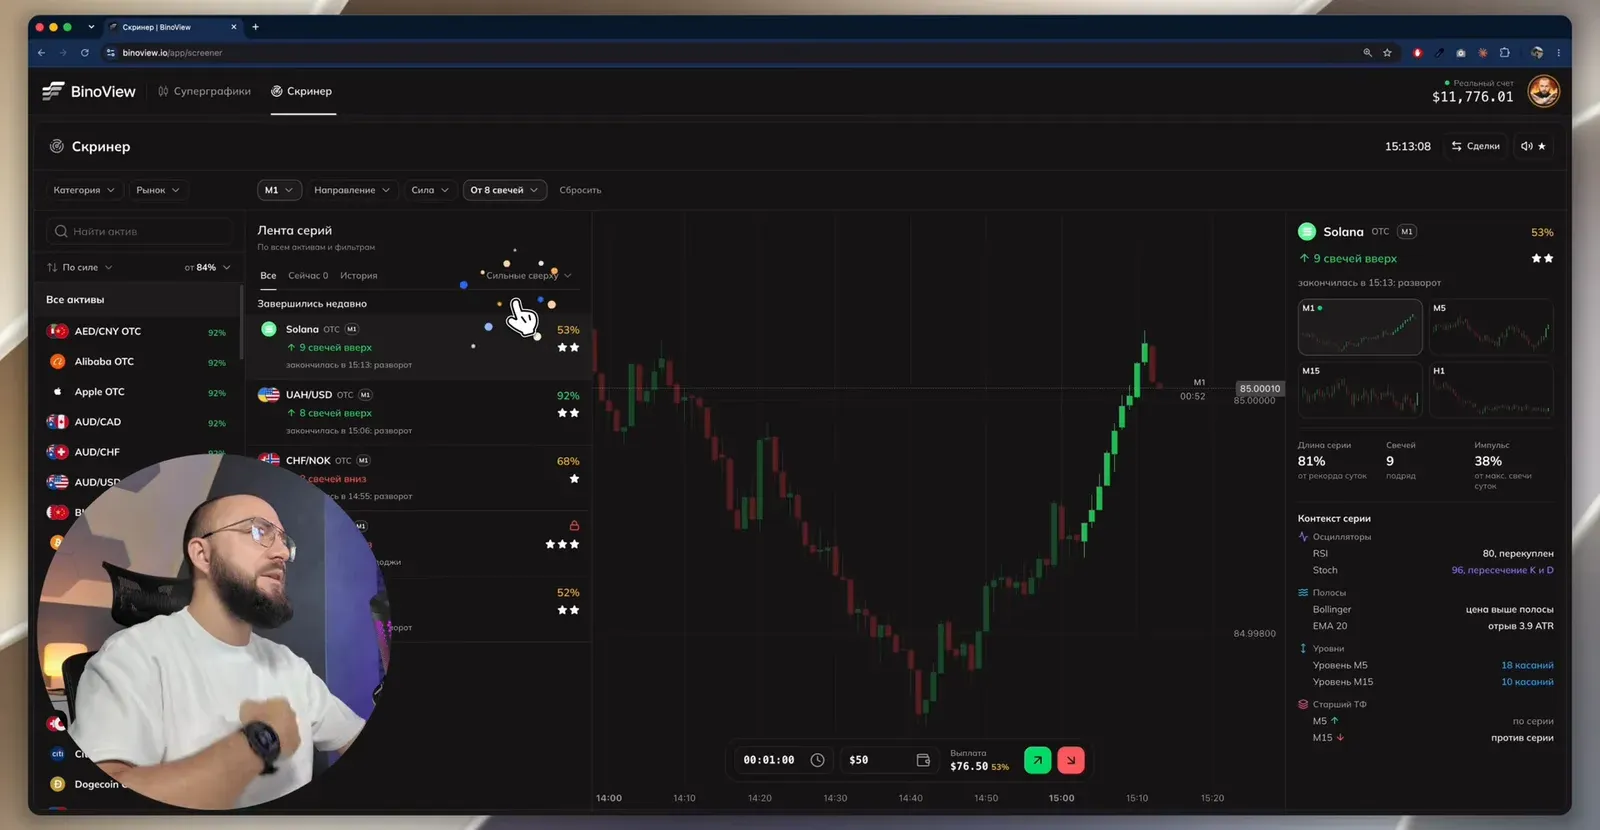
| Strength | any, from two stars, from three stars | cut out ordinary streaks |
| Length | from 4, 6, 8 or 10 candles | how extended a situation to catch |
Set direction "Up", strength "from two stars" and length "from 8 candles": two or three situations remain in the feed instead of twenty. This is a working set for a reversal strategy: a long streak with an impulse, after which we wait for a counter candle.
M1 and M5 timeframes
The screener looks for streaks on M1 and M5, and the choice is deliberate: find the situation on the 1-minute chart and read the context on higher timeframes. The panel on the right has four mini-charts: M1, M5, M15 and H1. Switch the filter to M5 and the feed shows streaks on the 5-minute chart, for example five candles up on Ethereum with a counter candle that has not closed yet and may extend the streak to six.
The Series Context panel
The most useful part of the screener. For the selected streak the indicator readings are gathered on the right without adding anything to the chart.
| Block | What it shows | Example from the video |
|---|---|---|
| Oscillators | the RSI value and zone, Stochastic and the K and D crossover | RSI 80, overbought; Stoch 96, K and D crossover |
| Bands | price position relative to Bollinger, distance from EMA 20 in ATR | price above the band; 3.9 ATR away |
| Impulse | the size of the last candle as a percentage of the day's record | candle 34% of record |
| Levels | M5 and M15 levels with the number of touches | M5 level: 18 touches |
| Higher TF | the direction of M5 and M15, with or against the streak | M5 with the streak, M15 against |
| Live candle | where the current, unclosed candle is heading | against the streak |
The same data appears in short form as tags right in the feed: "Counter candle", "RSI 17", "Stoch 4", "M5 level", "Edge of the day's range". The tags let you assess a situation without opening the chart.
A trade from the screener
Beneath the chart is the trade panel: expiration time, amount, payout calculation and the up and down buttons. There is an amount multiplier too. Indicators and bots cannot be added to the screener chart: if you need a signal bot check, copy the asset and open it in Supercharts.
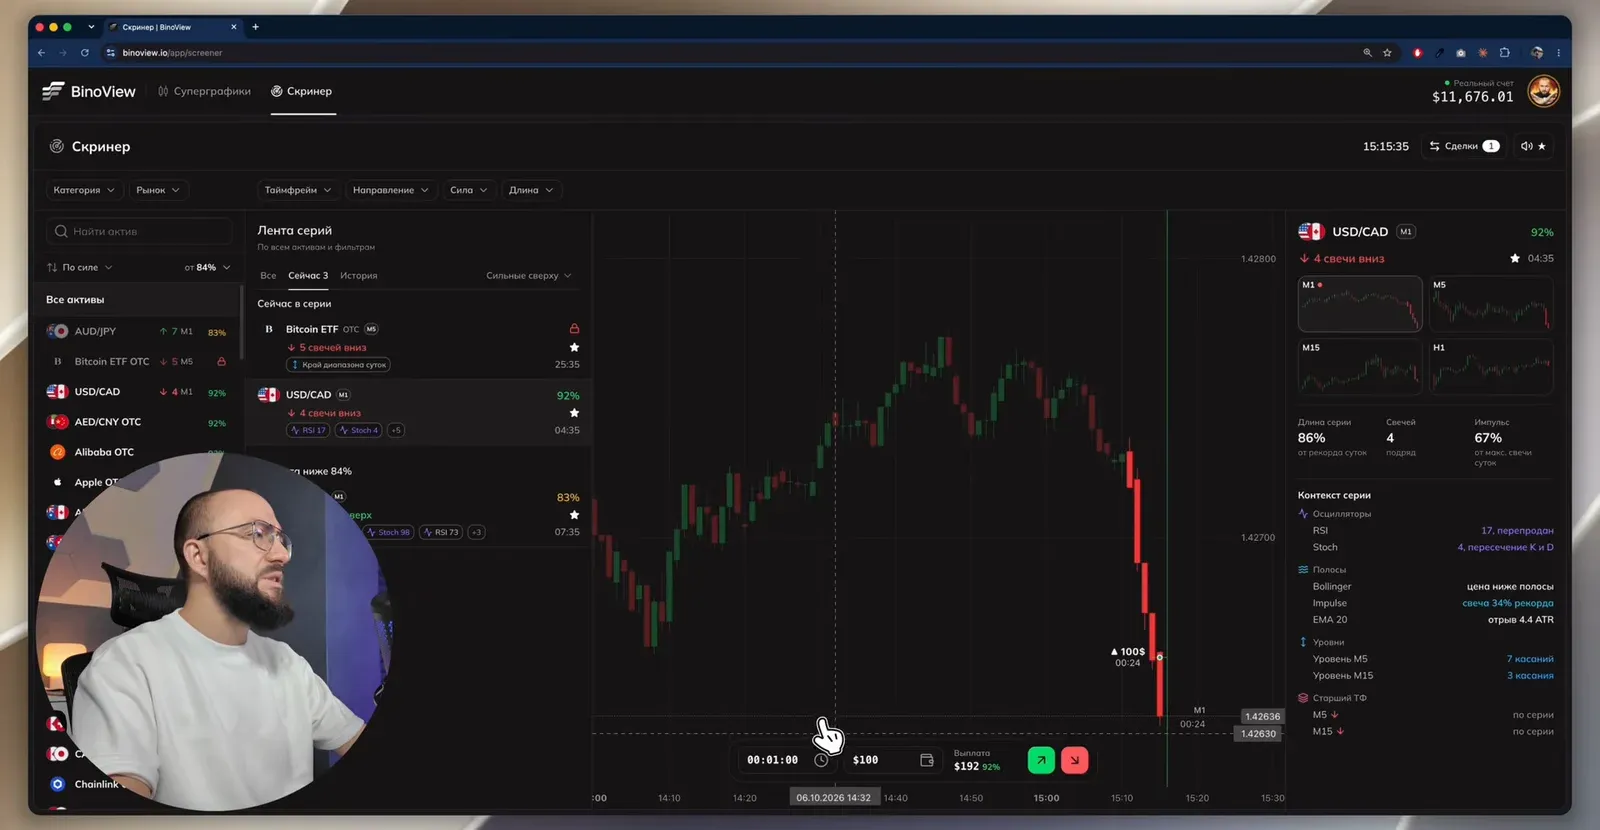
The USD/CAD trade
This is how a trade on a streak from the video is opened. Step by step:
- In the "Now in a streak" feed we see USD/CAD: four candles down, one star, payout 92%. Select the asset and the chart opens on the right.
- Prepare the trade: amount $100, expiration 1 minute. Wait for the current candle to close. The rule is simple: if the fourth candle closes green, the streak is broken and we do not enter; if red, we enter up at the open of the next one.
- The candle closed red, open a trade up. A loss: sellers keep pushing, the streak grows to six candles and gets three stars.
- Check the context. USD/CAD is an exchange pair, not OTC, so look at the economic calendar in Supercharts: the next news is 43 minutes away. On M15 price is at a level, on H1 the move is already sideways. Take one recovery by martingale with a coefficient of 2.2. Another loss.
- A third trade of $484 on the same logic. Three, two, one: a win, payout $929.28.
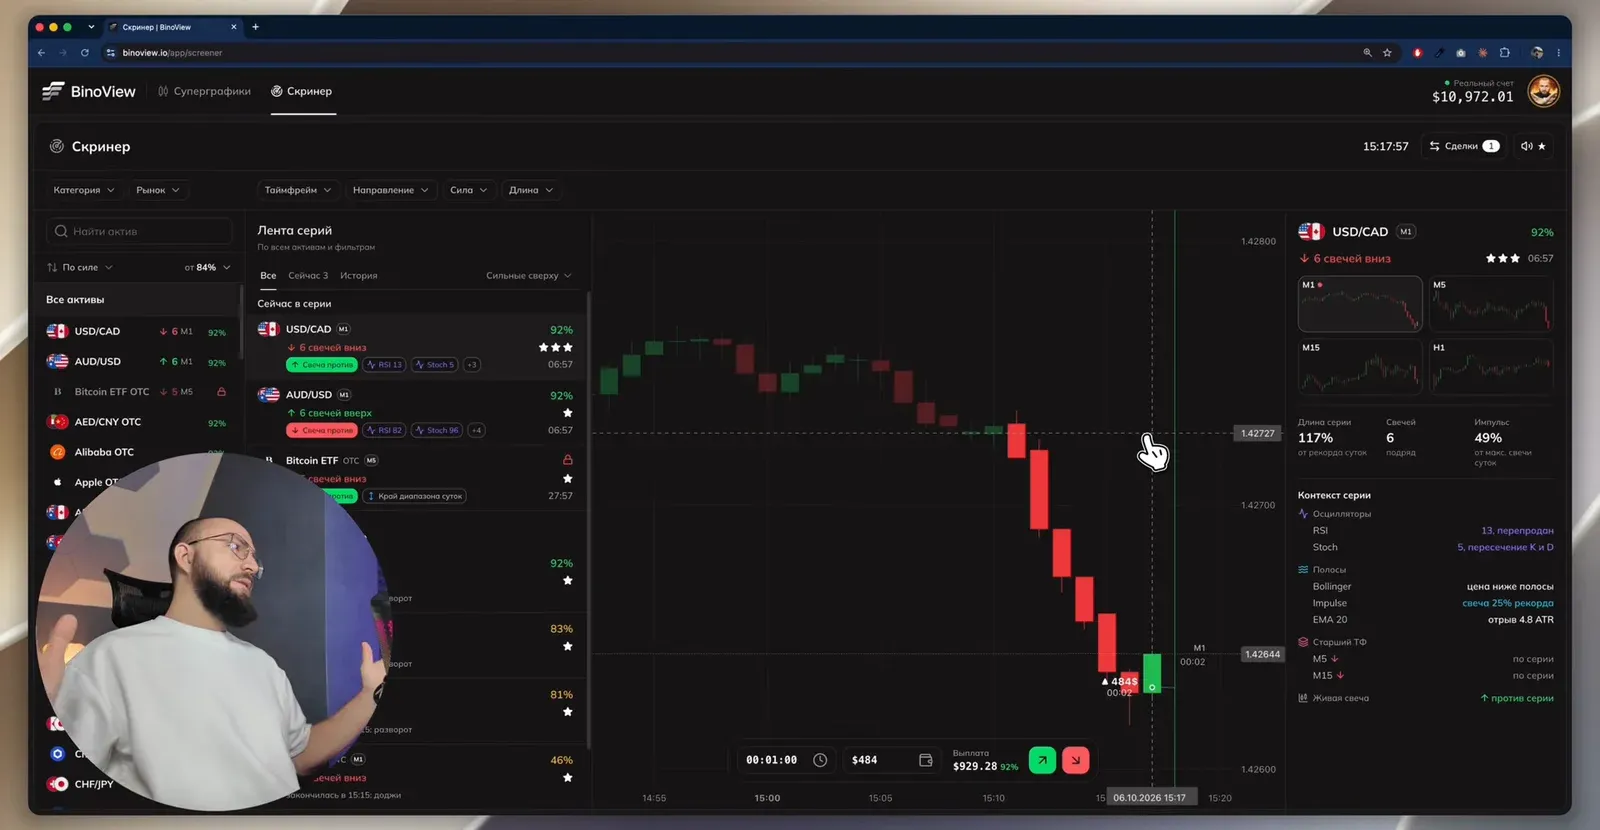
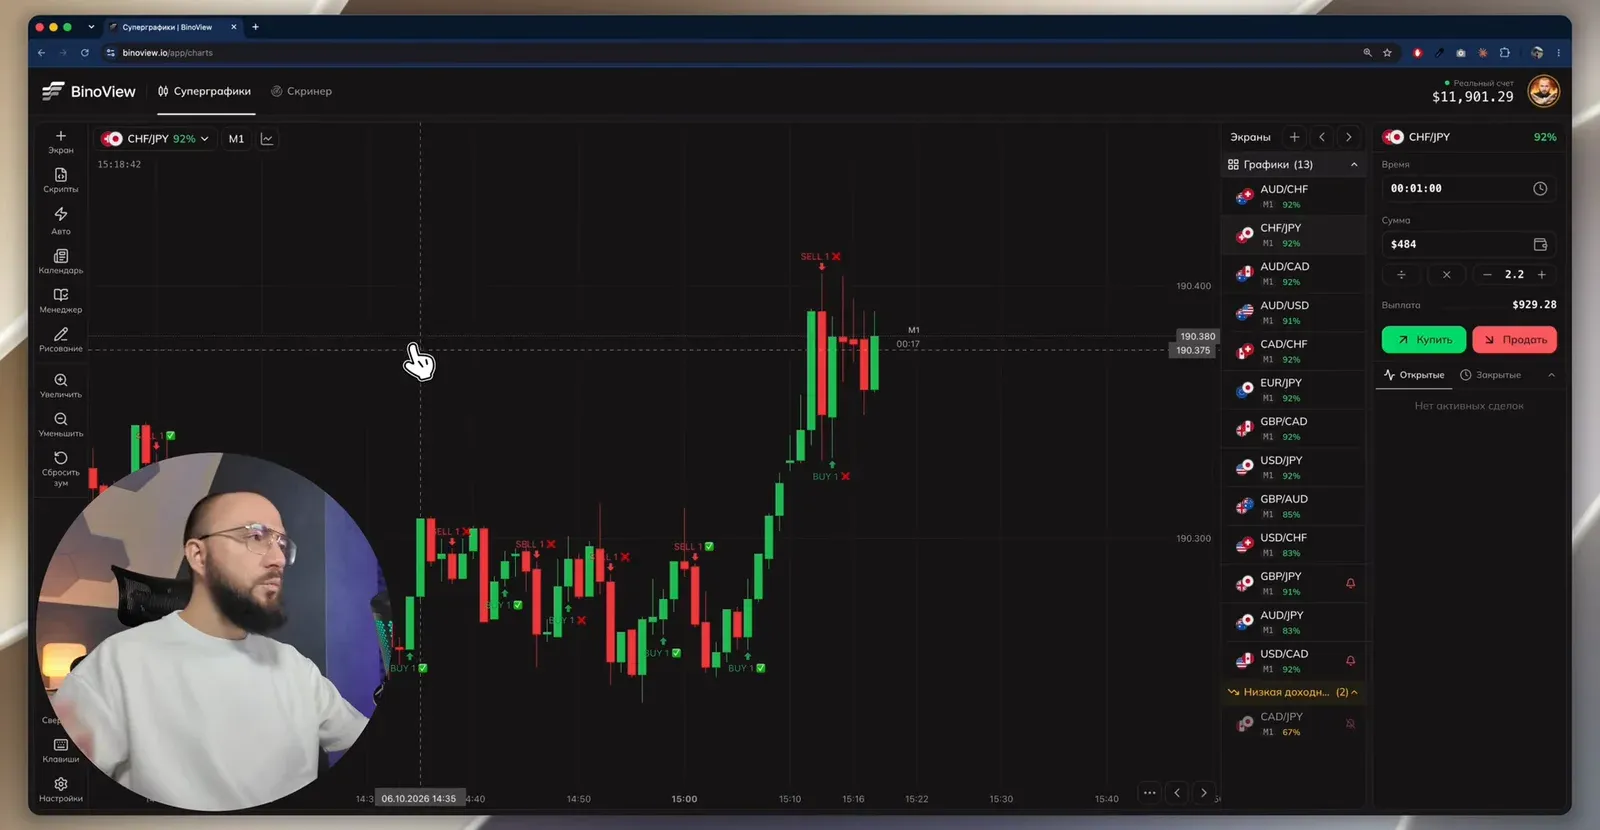
The result of the three-trade series: two losses of $100 and $220, a win on $484, the balance grew from $11,776 to $11,901, roughly +$125. This is the result of the recording, not a rule: the streak could have gone on, and then the recoveries would have reached dangerous amounts. If there is no win after one or two recoveries, look for another situation rather than going to the sixth step. The cost of a series for your bankroll can be calculated in the martingale calculator.
How to fit the screener into your trading
- Reversal strategy. Filters: length from 8 candles, strength from two stars, notifications on. Wait for a counter candle and confirmation in the context: RSI in an extreme zone, a higher-timeframe level.
- Trend strategy. Filters: length from 4 candles, direction with the higher-timeframe trend, M5 and M15 "with the streak" in the context. Enter for continuation after a short pullback.
- Check in Supercharts. Copy the asset, open it in the terminal, look at bot signals and indicators. A situation from the screener plus a bot confirmation is an entry; a mismatch is a skip.
- Low payout. Streaks with a payout below the threshold stay in a separate block. Entering them for 47% of the amount is a personal choice; by default we skip them.
FAQ
What is a sequence screener?
A tool that scans all of the broker's assets in real time and shows where a streak of same-colour candles is running: four, six, eight in a row. A streak is not a trade signal but a situation for your strategy: some trade the reversal after a long streak, others the continuation with the trend.
What do the stars next to a streak mean?
The strength of the situation, from one to three stars. It is calculated from the number of candles in the streak and the impulse, that is how much larger the candles are than usual for this asset over the last day. Three stars mean a long streak with a strong impulse, one star an ordinary one. Notifications can be limited to two or three stars only.
Can I add indicators to the screener chart?
No, the screener is deliberately minimalist: only the chart, the streak, the context and the trade buttons. If you need a bot or an indicator, copy the asset, open it in Supercharts and check the situation there. Both tools work at the same time and share trades and history.