Sequence Screener OTC Strategy: Trading Against a Candle Streak on Pocket Option
A counter-trend binary options strategy with the BinoView screener: entry against a streak of five or more candles on the 1-minute OTC chart, 1-minute expiration, no more than one recovery per asset. Payout and strength filters, checking levels and the higher-timeframe trend in Supercharts, the one-candle-later entry variant and a breakdown of the session from the video: from eight losses out of fifteen trades to +129,000 ₽ for the day.
Contents
A follow-up to the sequence screener overview: now live trading with it on a real account. The strategy is the simplest possible: the screener shows a streak of five same-colour candles on OTC, and we open a 1-minute trade in the opposite direction. Below are the entry rules, the filters, what to check in Supercharts before pressing the button, and a breakdown of a session that started with eight losses out of fifteen trades.
The idea of the strategy
The screener searches all assets in real time for streaks of same-colour candles and shows them in the feed. The strategy is counter-trend: after five or more candles in one direction we open a trade in the opposite direction, counting on a pullback. This is not a trend reversal but a bet on a single corrective candle, so the expiration is minimal.
An important limitation stated in the video right away: an entry against a streak is an entry against the move. When an active trend is running on M15, price can "saw through" such trades one after another, and the hit rate will be around 50/50. Hence two rules: no more than one recovery per asset and a mandatory check of the higher timeframe.
Settings
| Parameter | Value from the video |
|---|---|
| Market | OTC, evening hours |
| Screener timeframe | M1 |
| Expiration | 1 minute, entry at the candle open |
| Streak length | from 5 candles (the feed shows 3–6) |
| Strength | any; after a run of losses — from two or three stars |
| Payout | filter from 83%, below that the terminal warns |
| Trade amount | 10,000 ₽ |
| Recovery | one per asset, coefficient 2.2 |
| Context check | levels and trend on M5, M15, H1 in Supercharts |
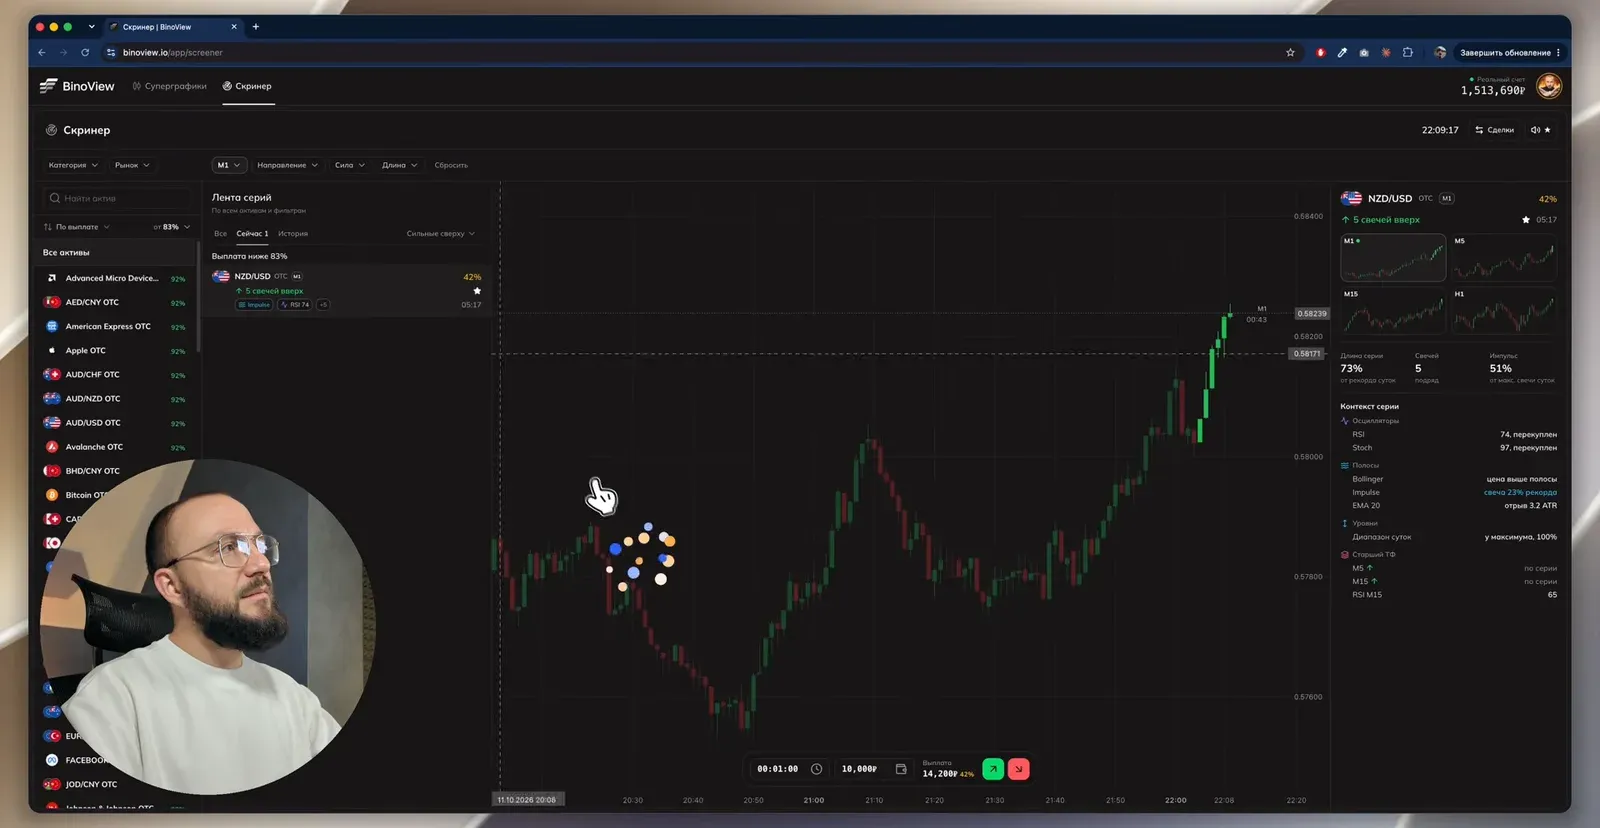
The payout filter works as a safety catch. In the video NZD/USD gives a streak of five candles up, but the payout is 42%: the screener moves the asset to the "Payout below 83%" block, and when you try to open a trade it warns in yellow. You can still open it, but there is no point.
Sequence Screener and other tools — in BinoView Supercharts
Entry rules
| Signal in the screener | Trade | Conditions |
|---|---|---|
| streak of 5+ green candles up | sell (down) at the open of the next candle | higher TFs not in a strong uptrend, no support nearby that is already being broken |
| streak of 5+ red candles down | buy (up) at the open of the next candle | higher TFs not in a strong downtrend, a support level below price |
| streak + impulse from 30% of the day's record | the same trade, higher priority | an impulse candle more often gives a pullback |
| the streak keeps growing after entry | one recovery trade on the next candle of the same asset | coefficient 2.2, after the second loss we leave the asset |
Extra reference points from the Series Context panel: RSI and Stochastic in extreme zones (in the video 29 and 2 for a streak down, 74 and 97 for a streak up), the "Counter candle" tag when the current candle is already forming against the streak, and price outside the Bollinger band.
The one-candle-later entry
The signal arrives at the open of a new candle. If you see the candle going away from the direction you were about to enter (a streak of five up, and the sixth rises again), do not enter on the signal: wait for it to close and enter one candle later. If the candle immediately went the right way, the setup has played out without you: skip it, there is no need to chase.
What to check in Supercharts
The screener is deliberately minimalist: no indicators, bots or trade manager. For the check we copy the asset (clicking its name copies the ticker) and open it in Supercharts.
- Levels. The Average Support Resistance indicator is enabled on the chart. If the nearest resistance level is far above and the trend is up, we do not sell against the streak: we wait for price to approach the level. If there is support under a streak down, a buy is justified.
- Higher timeframe. Look at M5, M15 and H1. In the video on EUR/HUF all three are down and there is one corrective candle up: this is an entry down with the trend, not against it. On JOD/CNY there is a streak of nine candles up without pullbacks: we do not take the counter-trend at all.
- The economic calendar is only needed for exchange assets; there is no news on OTC.
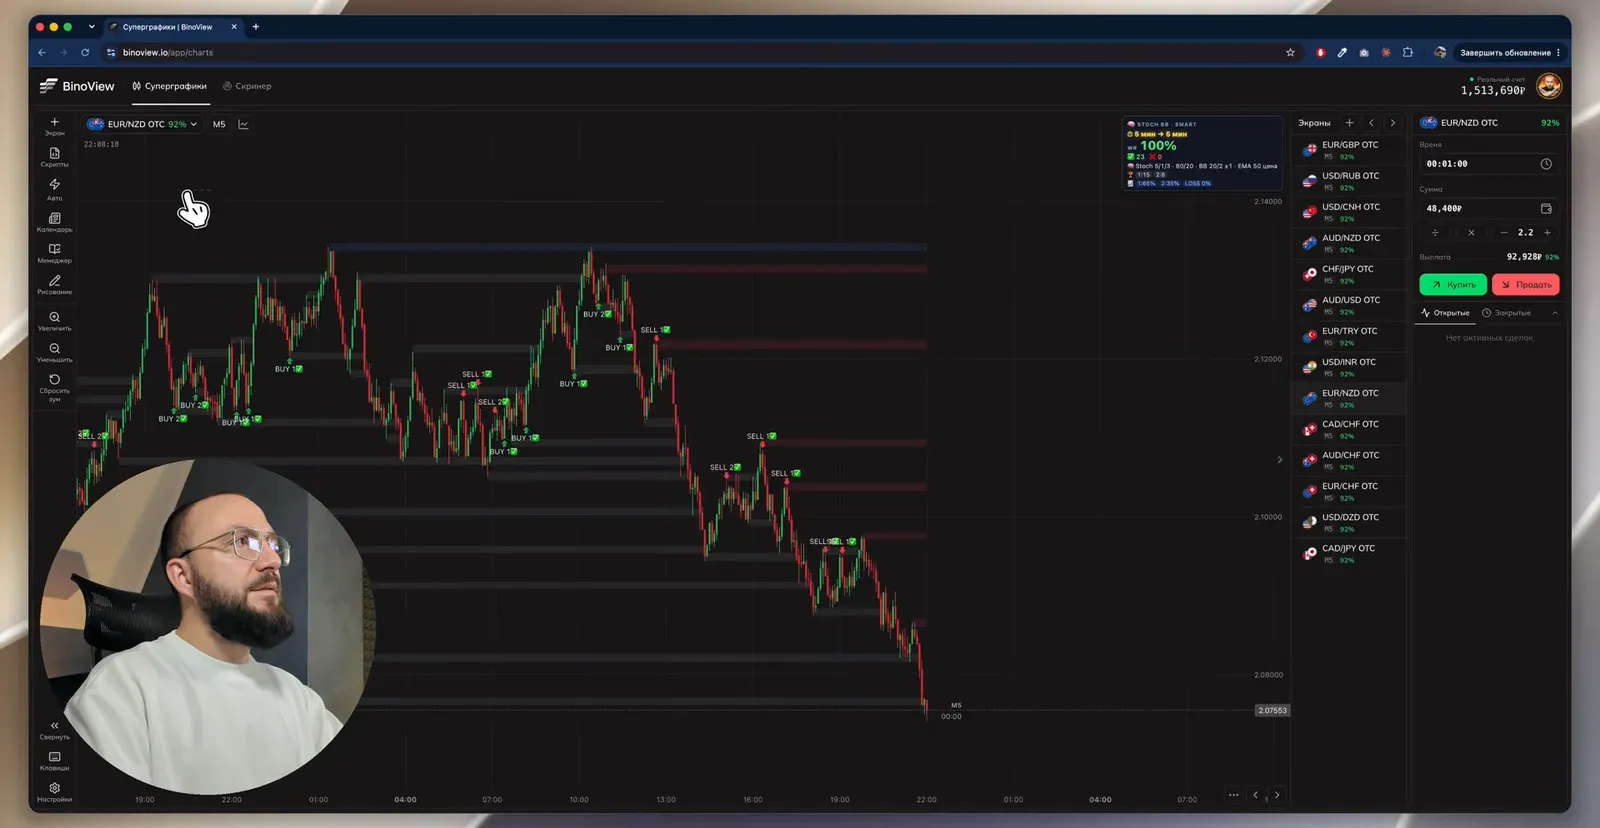
The trade manager with martingale can be launched in Supercharts and trades opened from there, with the screener remaining the search window. In the video the manager is launched and immediately switched off to avoid confusion: the trades were placed by hand.
Navigating the screener
- Selected an asset and everything disappeared. The feed shows only streaks for the selected asset; older situations may be in the history. Press Escape or "All assets" and the live feed returns.
- The "Now" tab shows streaks running this minute, "History" the finished ones with a note on how the streak ended ("reversal", "doji").
- Tags in the feed ("Impulse", "Against the M15 trend", "M5 level", "RSI 29") give an assessment without opening the chart.
- The "Reset" button resets only the timeframe, direction, strength and length filters. The payout filter lives separately.
Breakdown of the session from the video
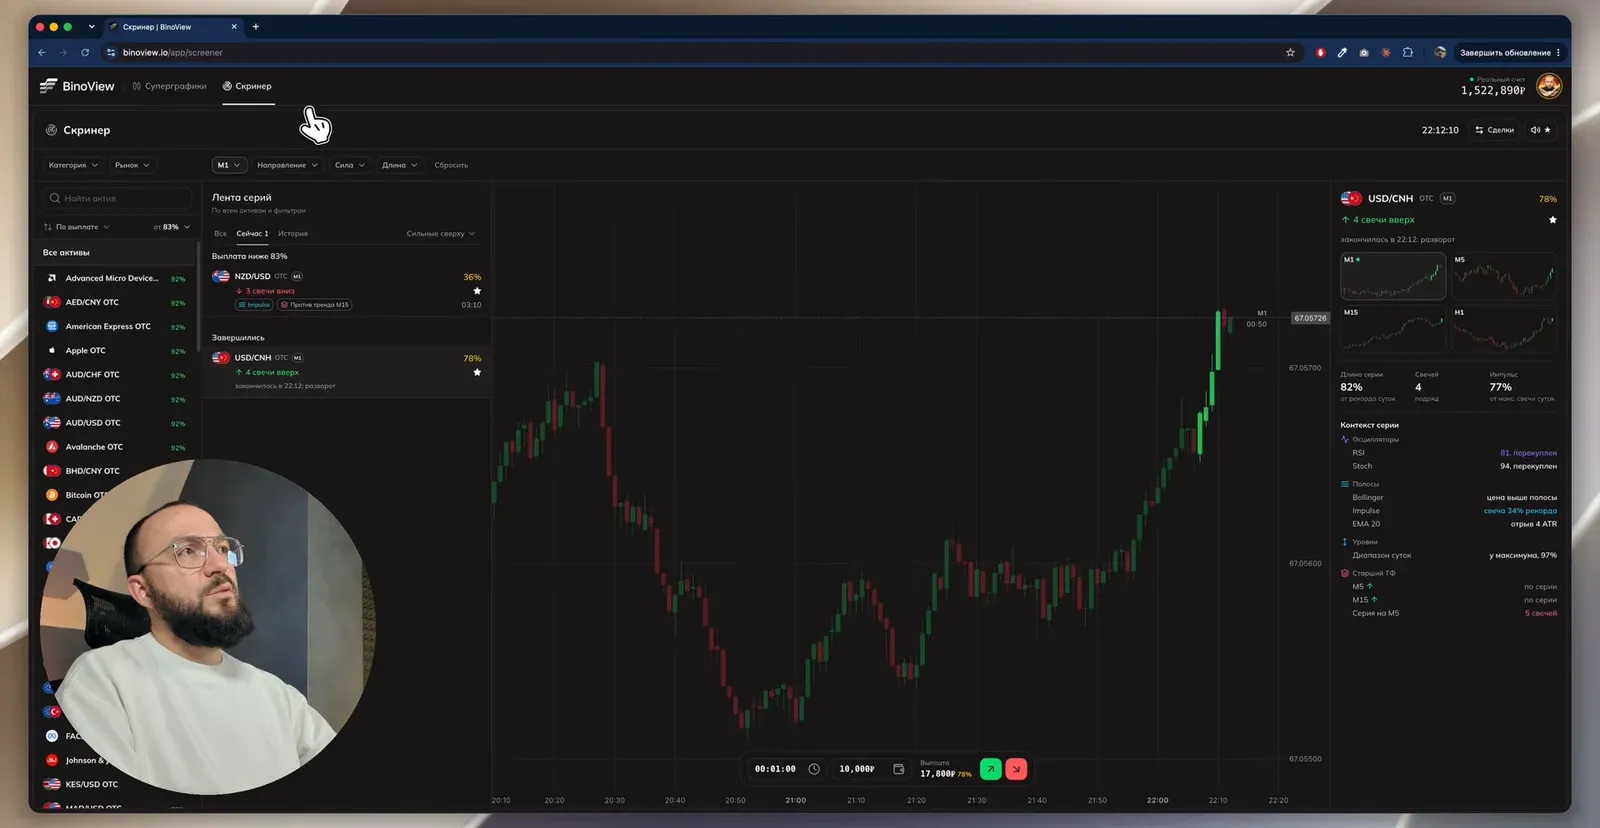
The recording opens with honest statistics: eight trades out of fifteen closed as losses, yet the day's result is +75,096 ₽. The sequence was "two losses, two wins, two losses, a win, a loss", that is a hit rate of about half, with the profit held up by the recoveries. Then, as the recording goes on:
- NZD/USD, five up, payout 42%. Skip: the payout filter does not let it through.
- Three candles down with an impulse of 30% of the day's record, one star. Buy, a win.
- EUR/HUF. M15, M5 and H1 are down, one corrective candle up. Sell with the trend, a win.
- American Express OTC, five down. A level nearby, an upward move on M15. Buy, a win. Four wins in a row on this stretch; at the 18-trade mark the day's result is +93,000 ₽.
- Apple OTC, five up. Sell against the streak, a loss. A recovery with a four-second delay (waiting for the previous trade to close), another loss. The asset is left without a third attempt.
- JOD/CNY, nine candles up without pullbacks, H1 levels close. Skip: we do not trade against a move with no pullbacks.
- CHF/NOK OTC, five, then six candles down, RSI 29, Stochastic 2, support under price, a downtrend on M5 and M15. Buy on the impulse, a loss. A recovery of 106,480 ₽: the candle breaks the level and shoots up on an impulse; in the feed the situation is marked as a false breakout down.
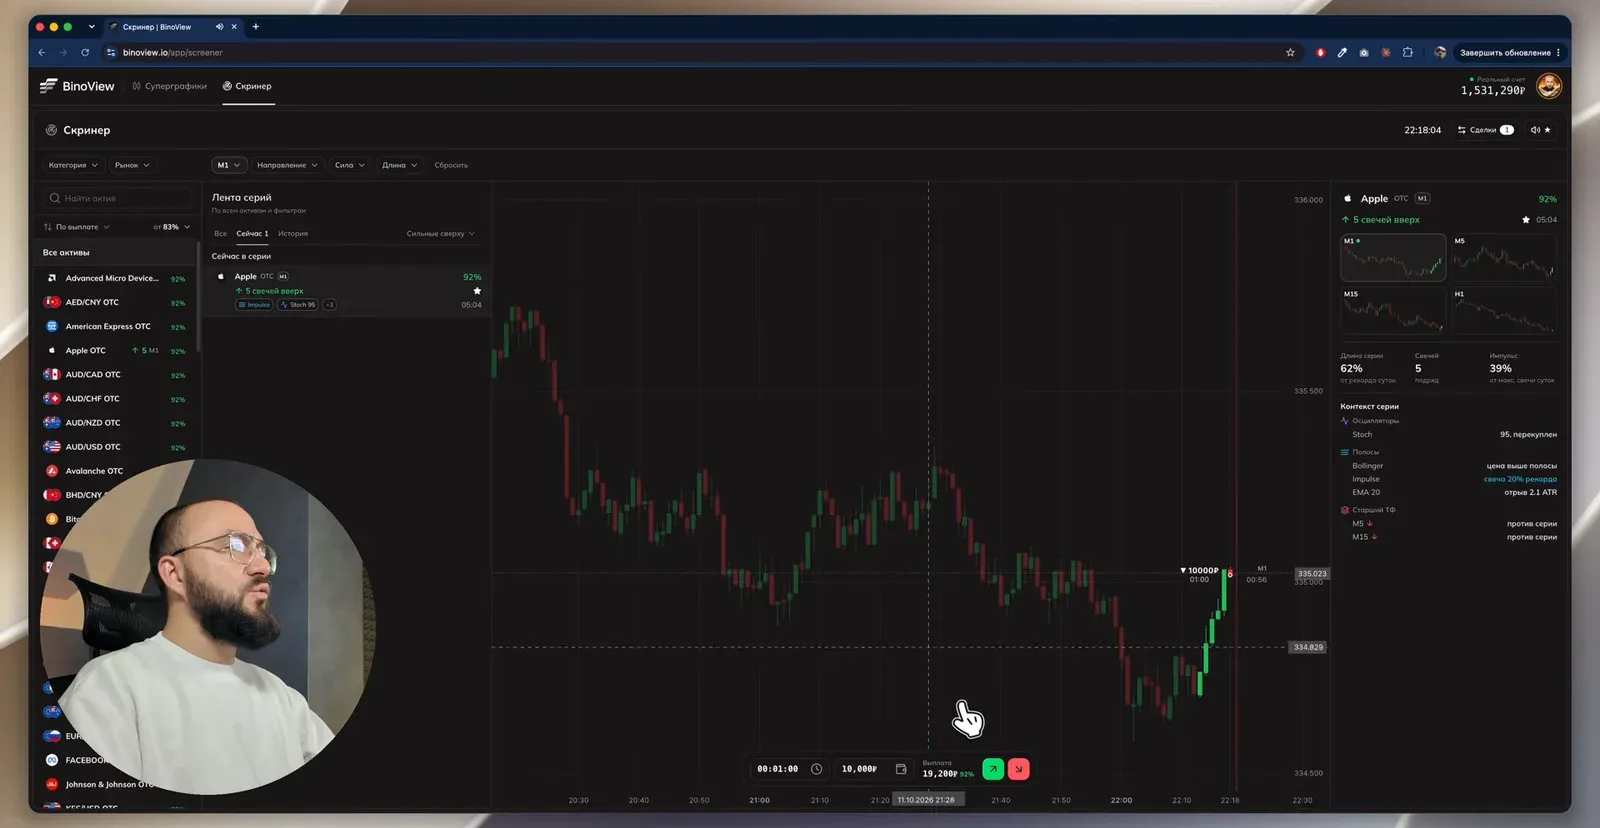
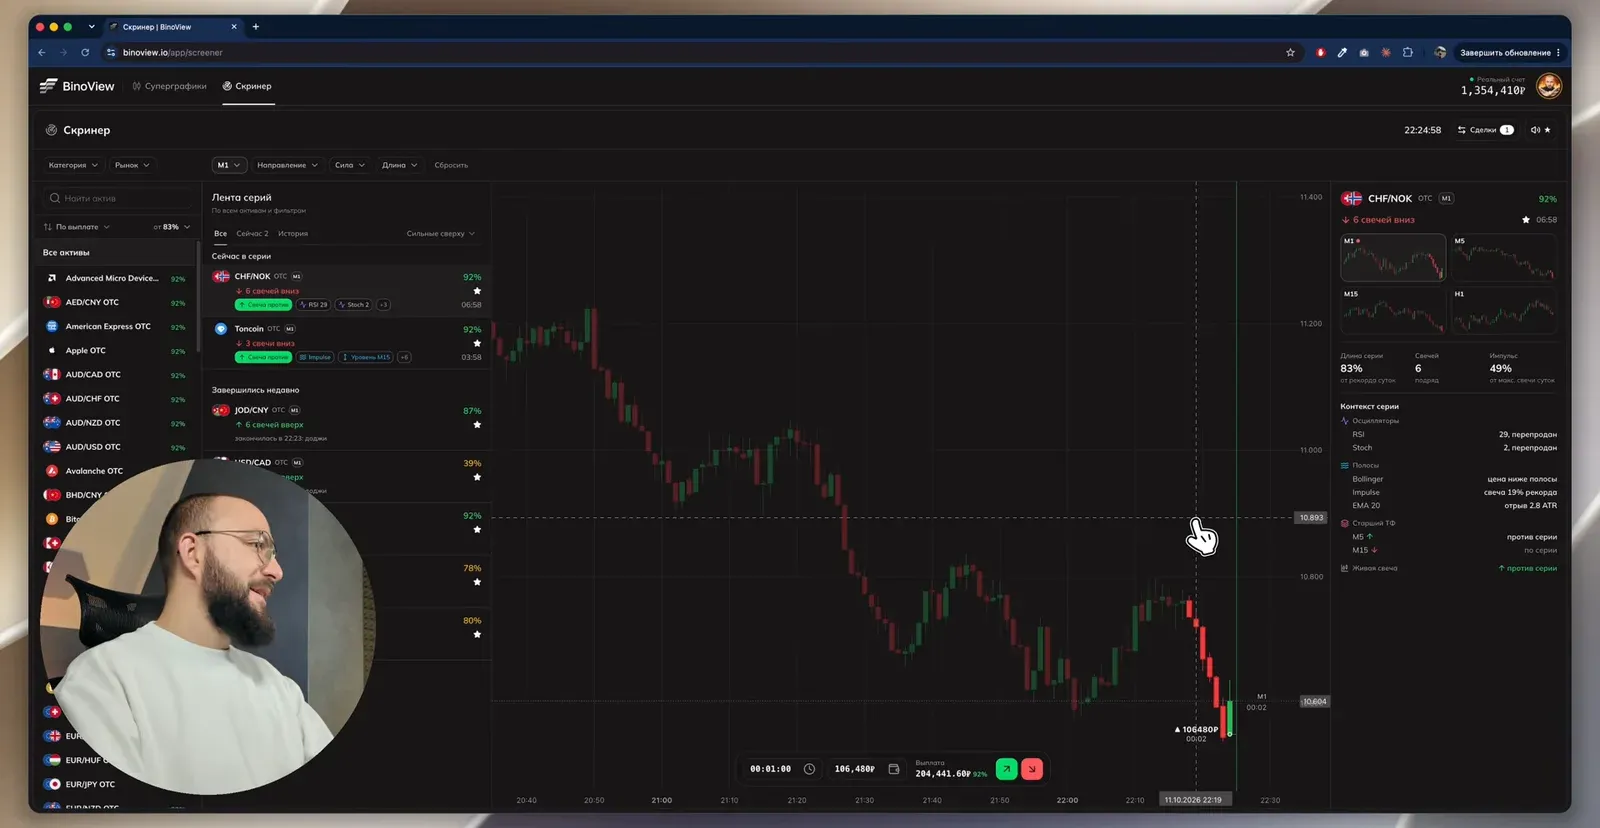
The result at the end of the recording: +129,000 ₽ for the day; the last series closed with three losses and one win that covered them. This is the result of the recording, not the strategy's expected return. Half of the day's trades closed as losses, and the profit came from recoveries at coefficient 2.2. What such a series costs at your bankroll and win rate is shown by the martingale calculator, and why you should not go to the fifth step is covered in the article on the daily loss limit.
FAQ
Why is the strategy counter-trend and what makes it dangerous?
An entry against a candle streak is a bet on a pullback after an extended move. If a strong trend is running on the higher timeframe, price can continue without a pullback, and the streak simply grows from five candles to nine. So before entering we look at M5 and M15: when they are flying in one direction without corrections, we skip the situation or enter with the trend.
How many recoveries to take after a loss?
The rule in the video is simple: no more than one recovery per asset, coefficient 2.2. If the recovery closes as a loss too, we leave the asset and wait for a new situation on another one instead of going to the fifth step. Beyond that it makes sense to tighten the strength filter to two or three stars and take only situations near a level.
Can I open the trade later rather than on the signal?
Yes, this is the second entry variant from the video. The signal arrives at the open of a new candle, and if it moves away from the direction you wanted to enter, wait for it to close and enter one candle later. If the candle immediately went your way, the setup has played out without you, and we skip such a situation.