Bouncing off a Level on the Real Market: a Pocket Option Strategy with S/R Signals Merged
Manual trading from support and resistance levels on real currency pairs, no OTC: the S/R Signals Merged indicator merges nearby levels, Adaptive Trend Finder draws trendlines. Range trading, broken resistance as support, a two-recovery limit, preset import and a session breakdown from the video.
Contents
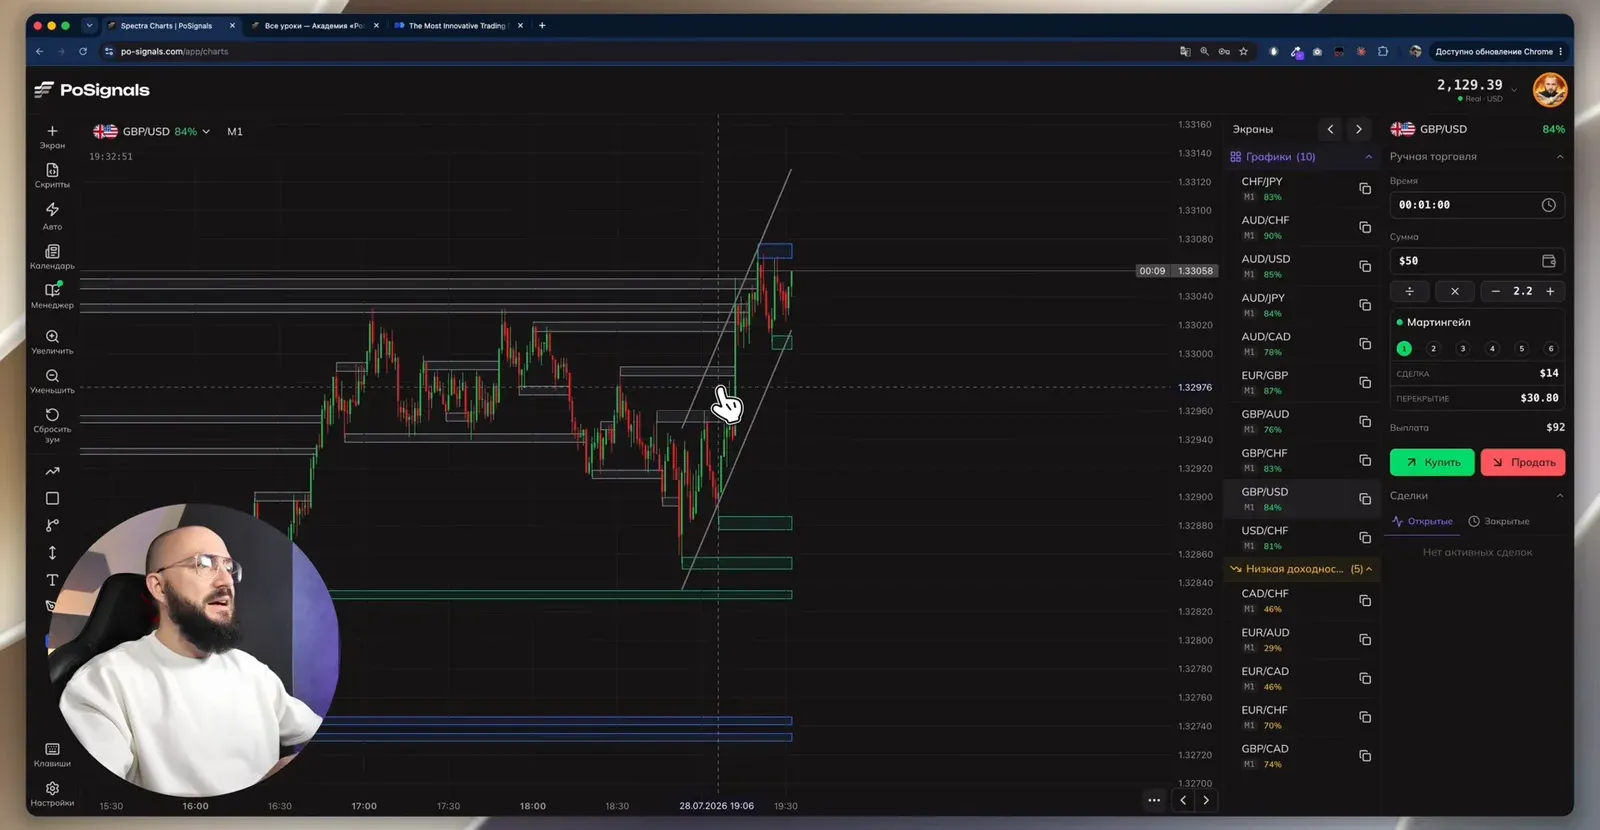
In this video Nick sets auto trading aside and trades support and resistance levels by hand on real currency pairs, no OTC. The account is a challenge started from $100: at the time of recording it holds $2,129. By then he has updated the levels indicator: S/R Signals Merged combines nearby levels into a single zone, and the chart stops looking like a mess. The first six trades of the session close as wins, then a series runs to the third step. Below are the settings, the preset, the rules and the breakdown.
Terminal setup
- Market type: real. Exchange currency pairs trade on weekdays and pay less than OTC. The author sets the "payout from 77%" filter and an alert when it drops below 76%.
- Auto-switching pairs every 3 minutes can stay on: assets whose payout has dropped leave the list, and paying ones get pulled in automatically.
- The trade manager runs in martingale mode: a calculated first trade of $14 (1% of the deposit), recovery trade $30.80, payout 92%, take-profit around $250. The author himself deliberately trades $50 with a $110 recovery trade, more on that below.
Two indicators and the preset from the video
| Indicator | What it does |
|---|---|
| S/R Signals — Merged | draws support and resistance zones and merges nearby levels into one zone |
| Adaptive Trend Finder | draws sloped lines of the local trend: approximate, but the direction is visible at once |
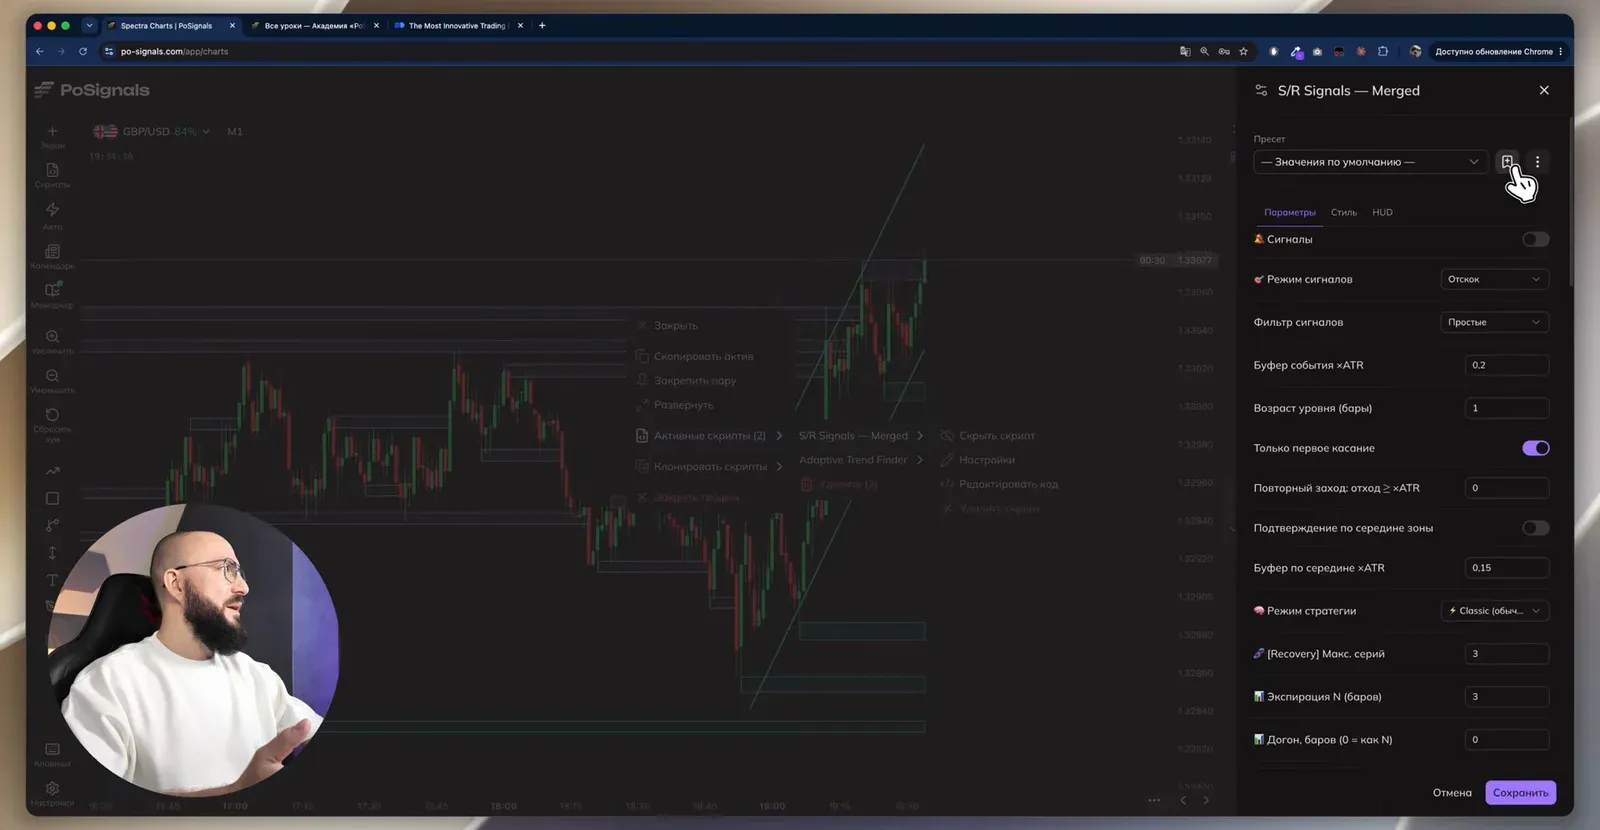
The author creates the preset right in the video and posts its code to his Telegram channel. Its parameters are the defaults; only the style is changed: line visibility and zone transparency. The indicator's signals are off, only the levels are needed.
| S/R Signals — Merged parameter | Value |
|---|---|
| Signals | off |
| Signal mode | bounce |
| Signal filter | simple |
| Event buffer | 0.2 ATR |
| Level age | 1 bar |
| First touch only | on |
| Mid-zone confirmation | off |
| Expiration N (bars) | 3 |
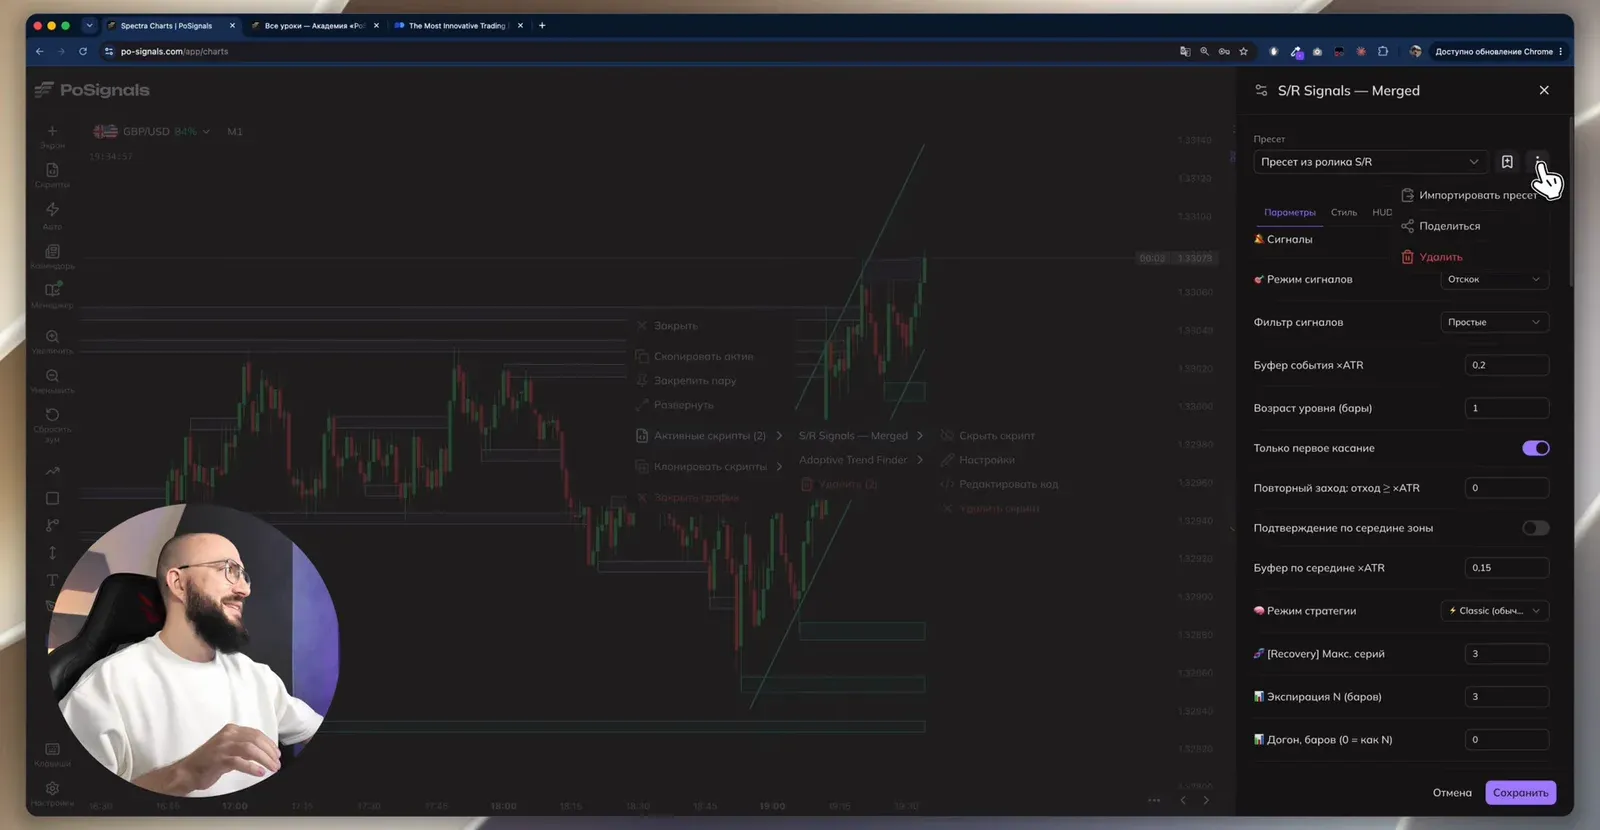
Import: in the indicator settings tap the three dots next to the preset list → "Import preset" → paste the code.
S/R Signals — Merged and other tools — in BinoView Supercharts
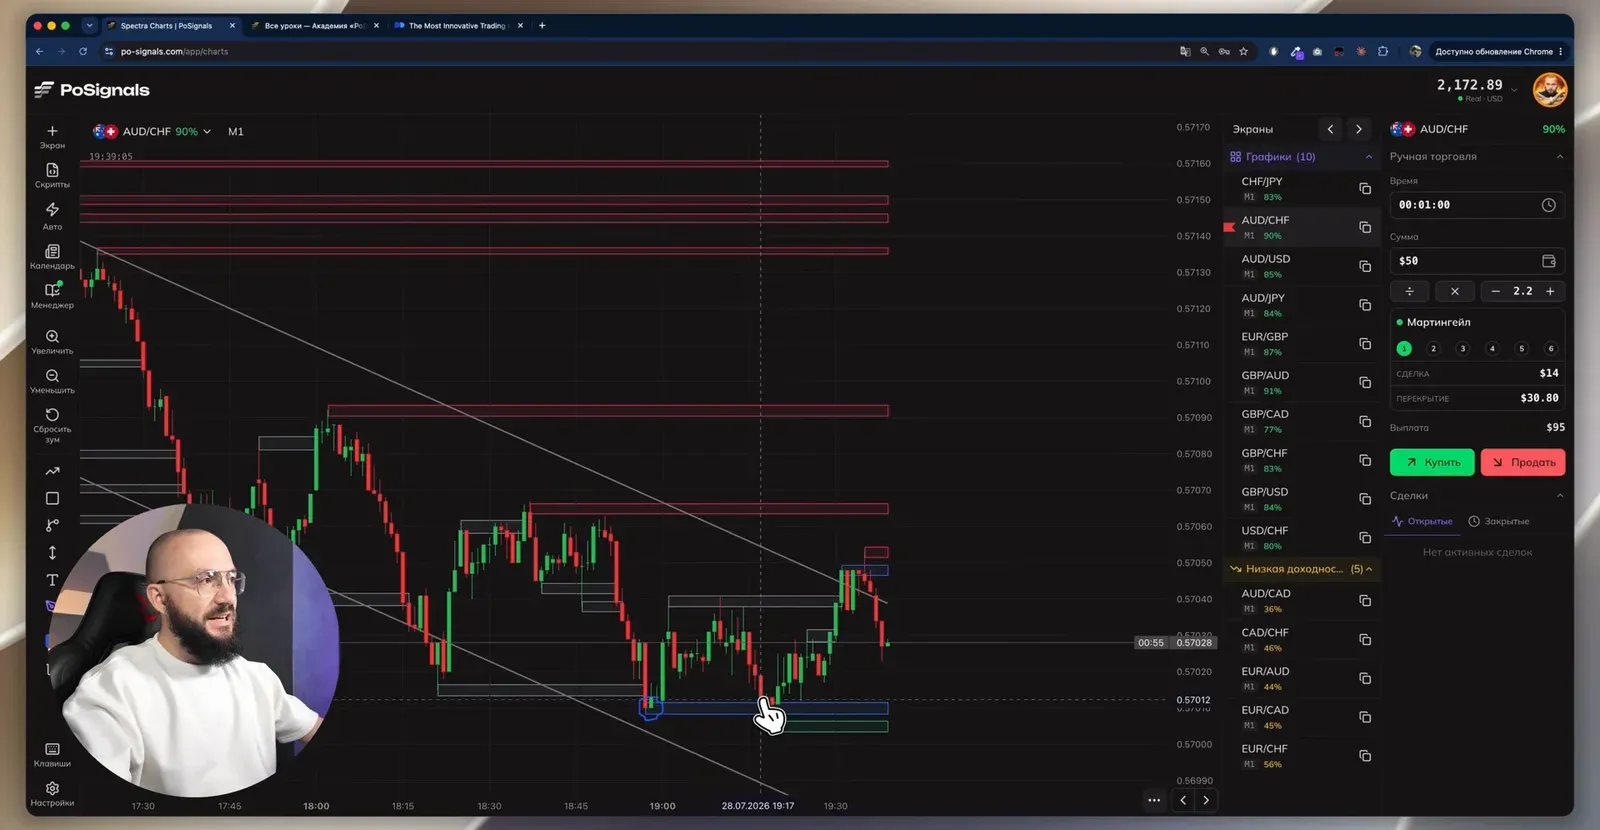
How to read the colors
- red zone — resistance, look for a sell;
- green — support, look for a buy;
- blue — a level that already produced a bounce: the reaction is confirmed, and the author values these most;
- grey — a level from the past or a broken one, for example after a false break.
A level is a zone with a tolerance, not a line. Price does not have to reach it exactly.
Entry rules
- A bounce off a level with a reaction. You need a level that already produced a bounce, or a local level with two or three touches. Entry at the candle open for 1 minute, when price has approached the level calmly.
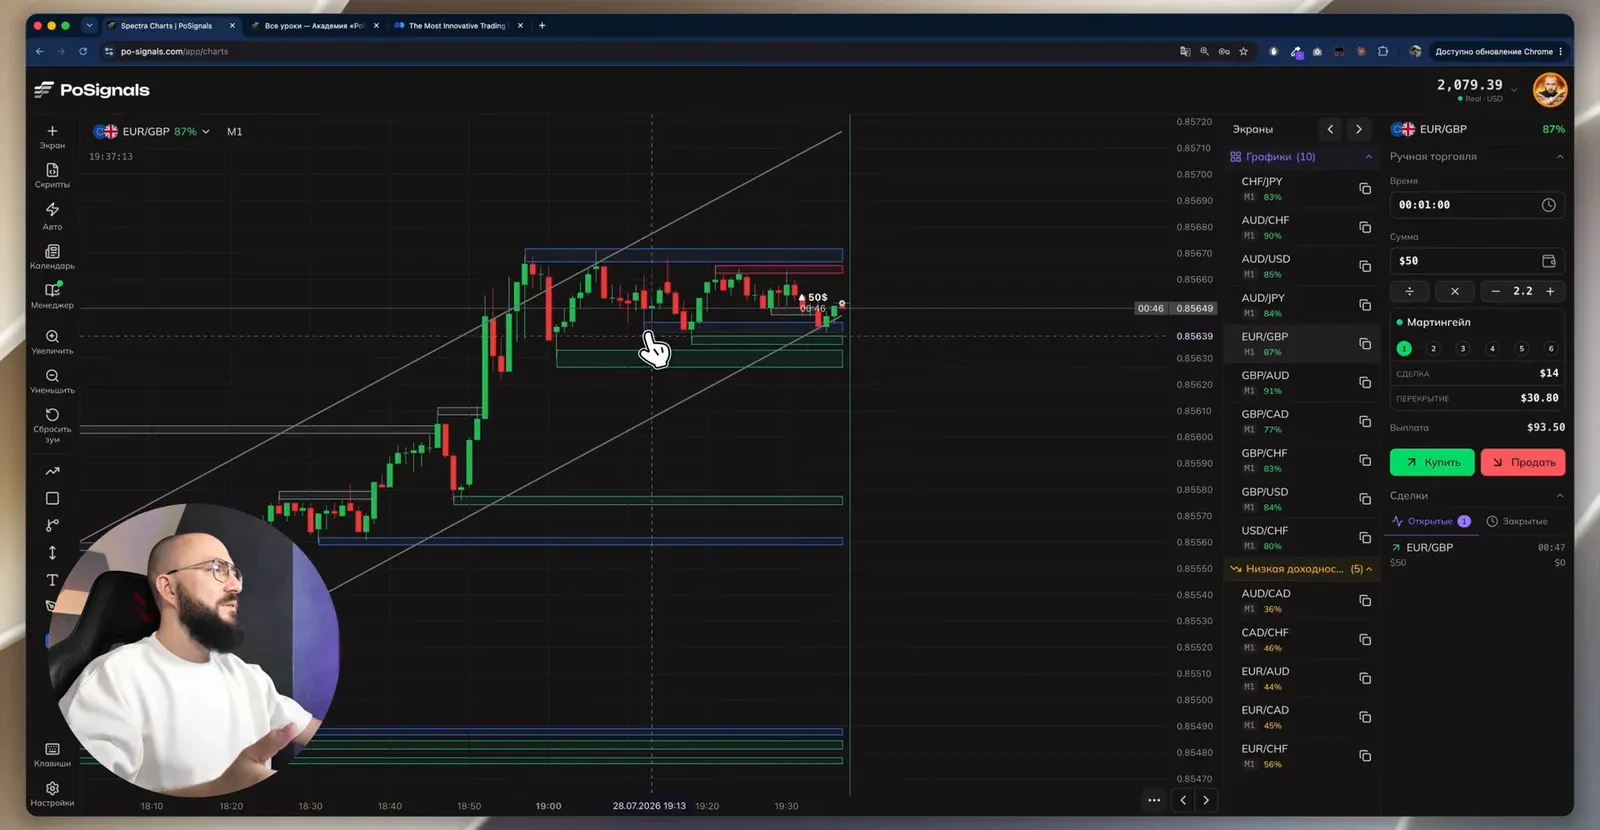
- A range is traded from edge to edge. In a sideways market price moves between two levels: buy at the lower edge, sell at the upper. After a breakout from the range the author waits for a corrective candle and enters in the direction of the breakout.
- The trend is checked on M5 and M15. Trades with the trend get priority. The higher timeframes show whether price has "room to run": an unfilled imbalance above, for example.
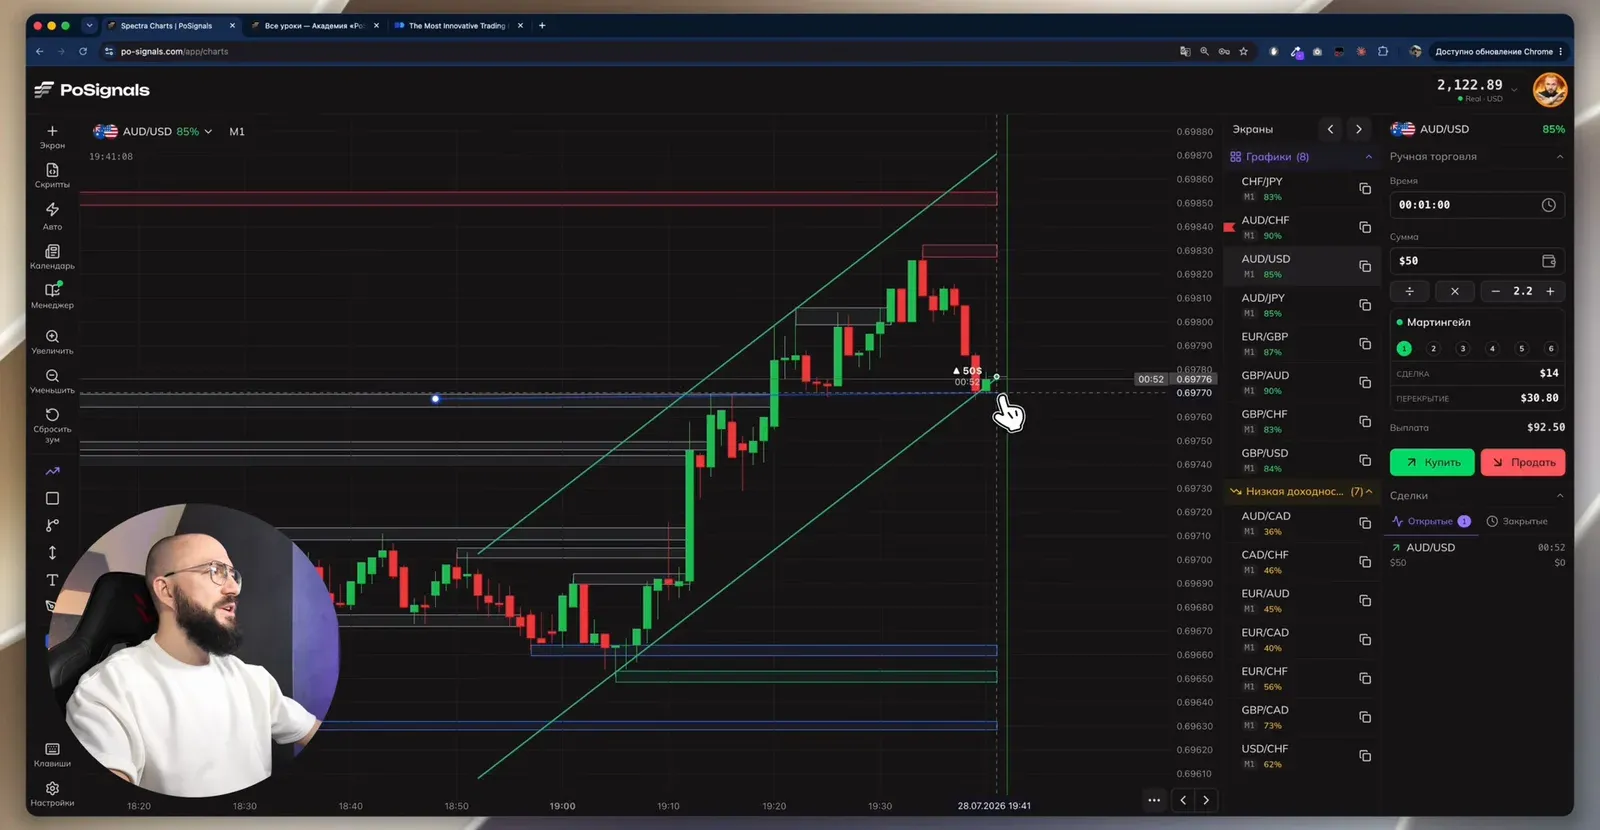
- Broken resistance becomes support. After a break, a trade opens from the same level in the direction of the break, especially with a trendline through three or four points nearby.
- No entry on an impulsive break. If a level is broken by a strong candle, price heads for the next level. Wait for a more convincing setup.
- At most two recovery trades per asset. The first trade plus two recovery trades, then move to another asset.
- Do not chase a missed setup. If it played out without you, look for the next one; the market produces a new setup every minute.
Money management
The author's base rule is 1% of the deposit on the first trade or less. He himself trades $50 on a $2,129 deposit, over 2%, and explains it by experience: he understands what he is doing and knows how to handle a loss. He advises beginners not to copy that.
What an imbalance is
The author mentions an imbalance when checking M15: it is a price gap left after an impulsive candle, a stretch the market crossed too fast and often comes back to fill. An unfilled imbalance above the current price is an argument that the move up is not exhausted yet. More on imbalance zones in the Imbalance Suite indicator review.
The session from the video, trade by trade
- Before the recording — three trades out of three won: two up, one down.
- EUR/GBP, buy at the lower edge of a range after a trending rise; sideways on M5. Win, the fourth in a row.
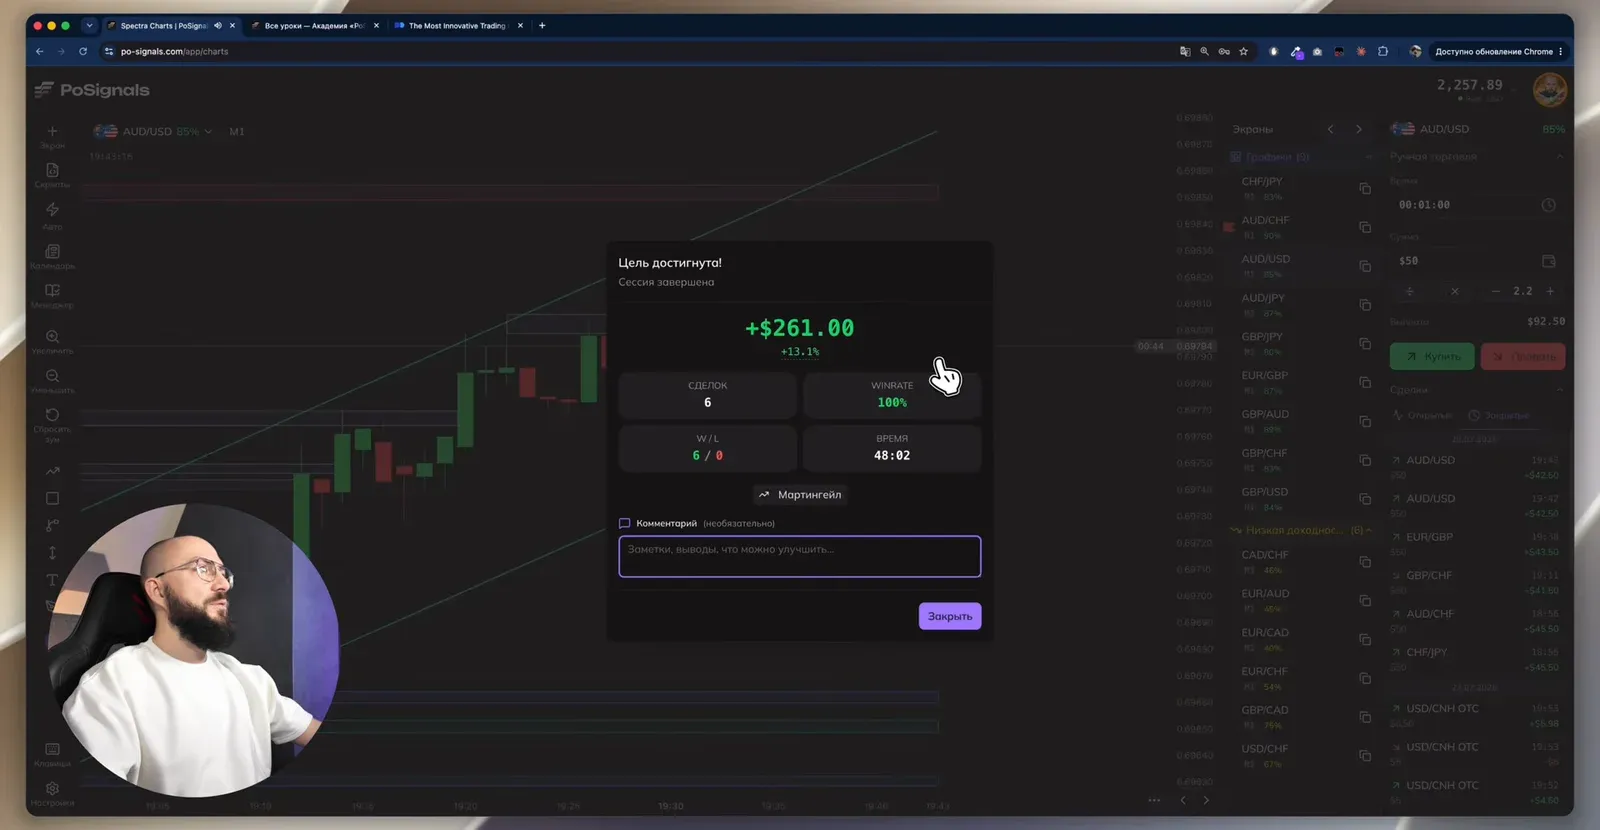
- AUD/USD, buy from broken resistance turned support, with a trendline nearby. Win. Then one more buy on the active candle on the same asset, another win: the session target is reached at +$261, 6 trades, 6 out of 6.
- A new session. The author misses a setup on AUD/CHF while restarting the manager and reminds: do not chase what you missed.
- CHF/JPY, buy at the upper edge of a range with the M5 and M15 trend. Loss. A $110 recovery trade on an impulse ends as a refund: price closed at the entry level.
- A sell from a blue level in a range, $110, amid low-importance US news. Loss. A recovery sell from the same level, which also touches a stronger resistance nearby. Win, the series is covered.
The first session ended at +$261 with six wins in a row. The second series ran to the third step and closed as a win thanks to the recovery trade. The author notes that this strategy does not produce many trades, so patience and chart experience matter most.
Before you test it
- Real market or OTC. The strategy is shown on exchange pairs. It works on OTC too, but the quotes there are synthetic, see the OTC article.
- News. Even low-importance news moves price: the loss in the video came at 19:30 US time.
- Few trades. There may be only a handful of by-the-rules setups per session; the strategy takes patience.
- A demo account to practice. Learn to read the zone colors and ranges first, then the real account.
FAQ
How is S/R Signals Merged different from Average Support Resistance in the other levels strategy?
Both indicators draw support and resistance zones, but Merged combines several nearby levels into one: instead of three lines at different heights you get a single zone. The color logic is the same: red is resistance, green is support, blue is a level that already produced a bounce, grey is a past or broken level.
How do I import the preset from the video?
In the indicator settings tap the three dots next to the preset list, choose 'Import preset' and paste the code. The author posted the code in his Telegram channel together with the link to the video.
Why doesn't the author enter when a level is broken by a strong impulse?
After an impulsive break price usually travels to the next level instead of coming back. A bounce is traded only where the level has already shown a reaction and price approaches it calmly, without acceleration.