Pocket Dashboard Strategy for Binary Options: Trend Entries on a Pullback
A trend-following strategy on real currency pairs with the Pocket Dashboard indicator: Strong Buy or Strong Sell status, agreement of the M5 and M10 timeframes, entry after a corrective candle with a 1-minute expiration, EMA 50 as a filter, one recovery trade per asset. A 2-minute expiration variant with a Bollinger Bands + Stochastic filter. Two session breakdowns from the videos.
Contents
This is the strategy Nick says he started with: one indicator, one rule and real currency pairs without the OTC suffix. Pocket Dashboard gathers the readings of moving averages and oscillators across three timeframes into a single table, and the trader enters only with the trend and only on a pullback. At the end there is a variant from an earlier video: a 2-minute expiration with Bollinger Bands and Stochastic confirmation.
Preparation
- Economic calendar. High- and medium-importance news on the pair's currencies: no trades 30 minutes before and 30 minutes after the release. The market needs to "catch its breath" and pick a direction.
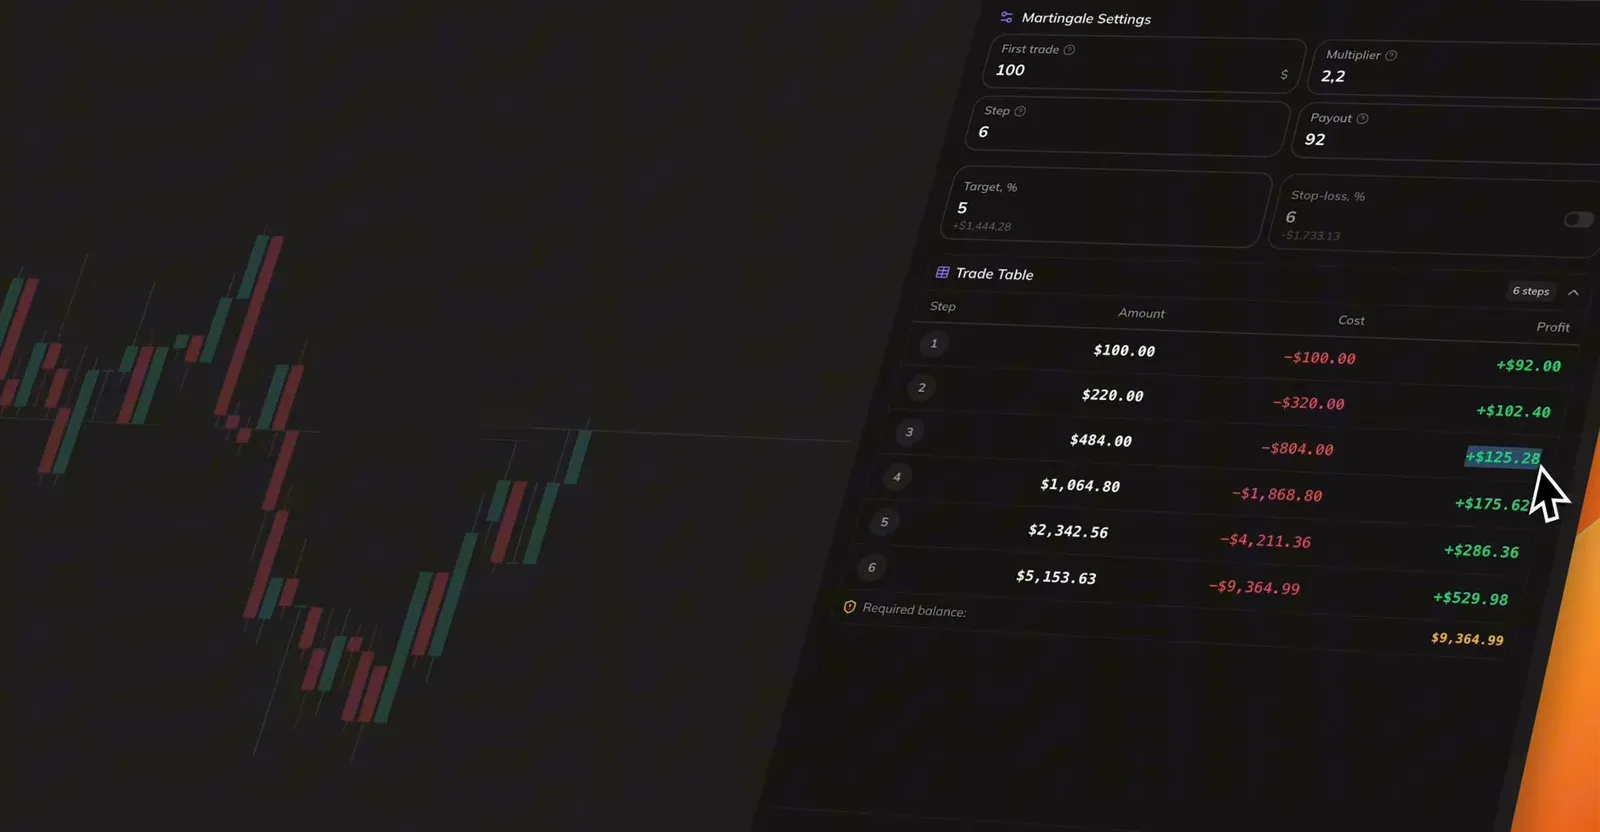
- Trade manager. Martingale: first trade $100, multiplier 2.2, six steps, payout 92%, target 5%. The manager suggests the next step size and logs trades to the journal.
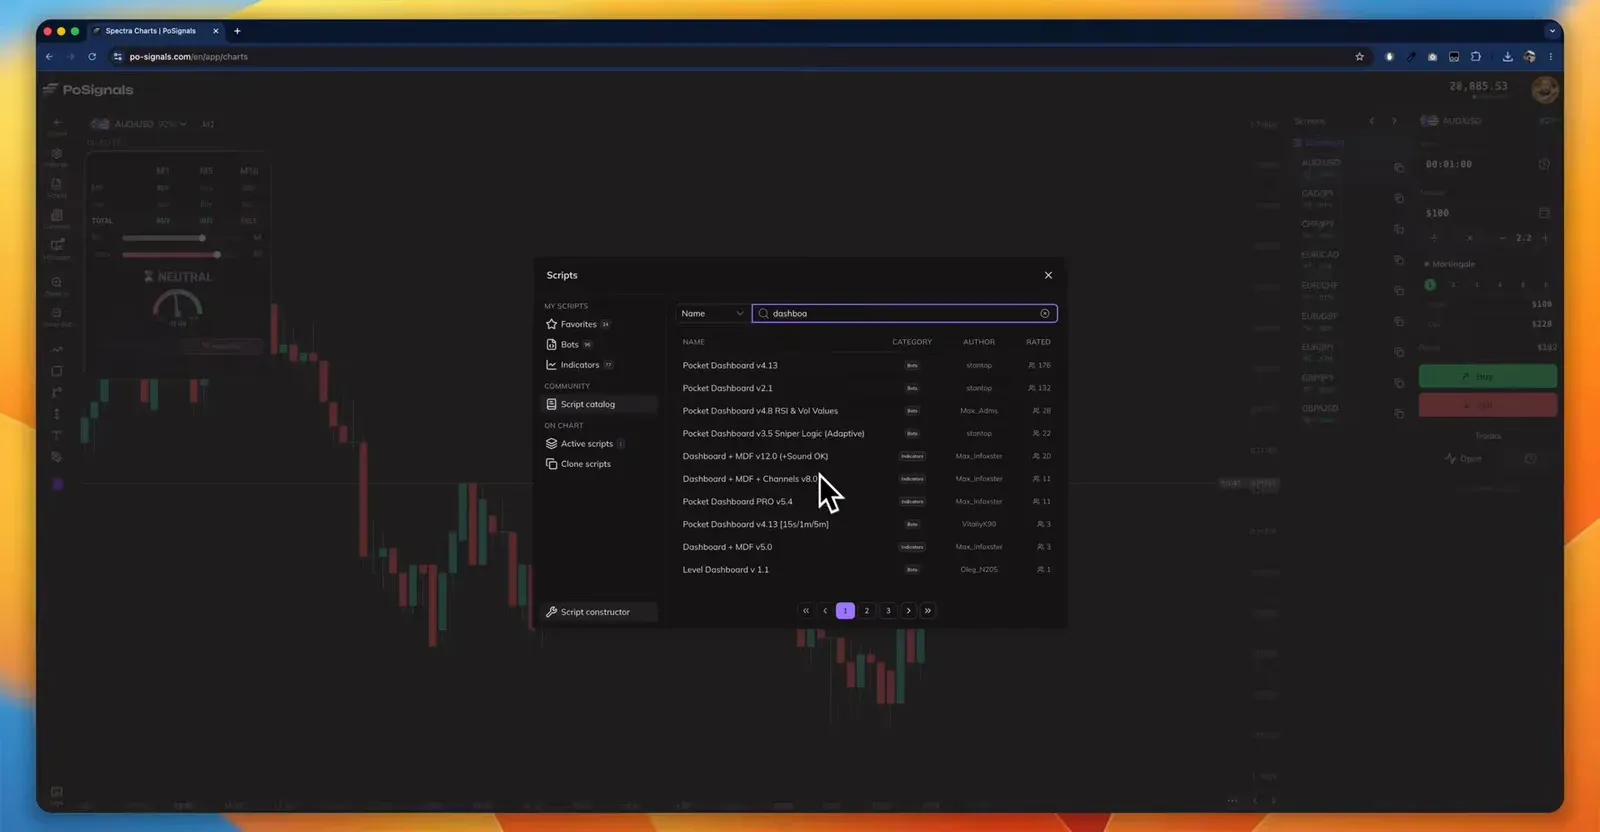
- Pocket Dashboard from the script catalog: search "dashboard", version 4.13, default settings.
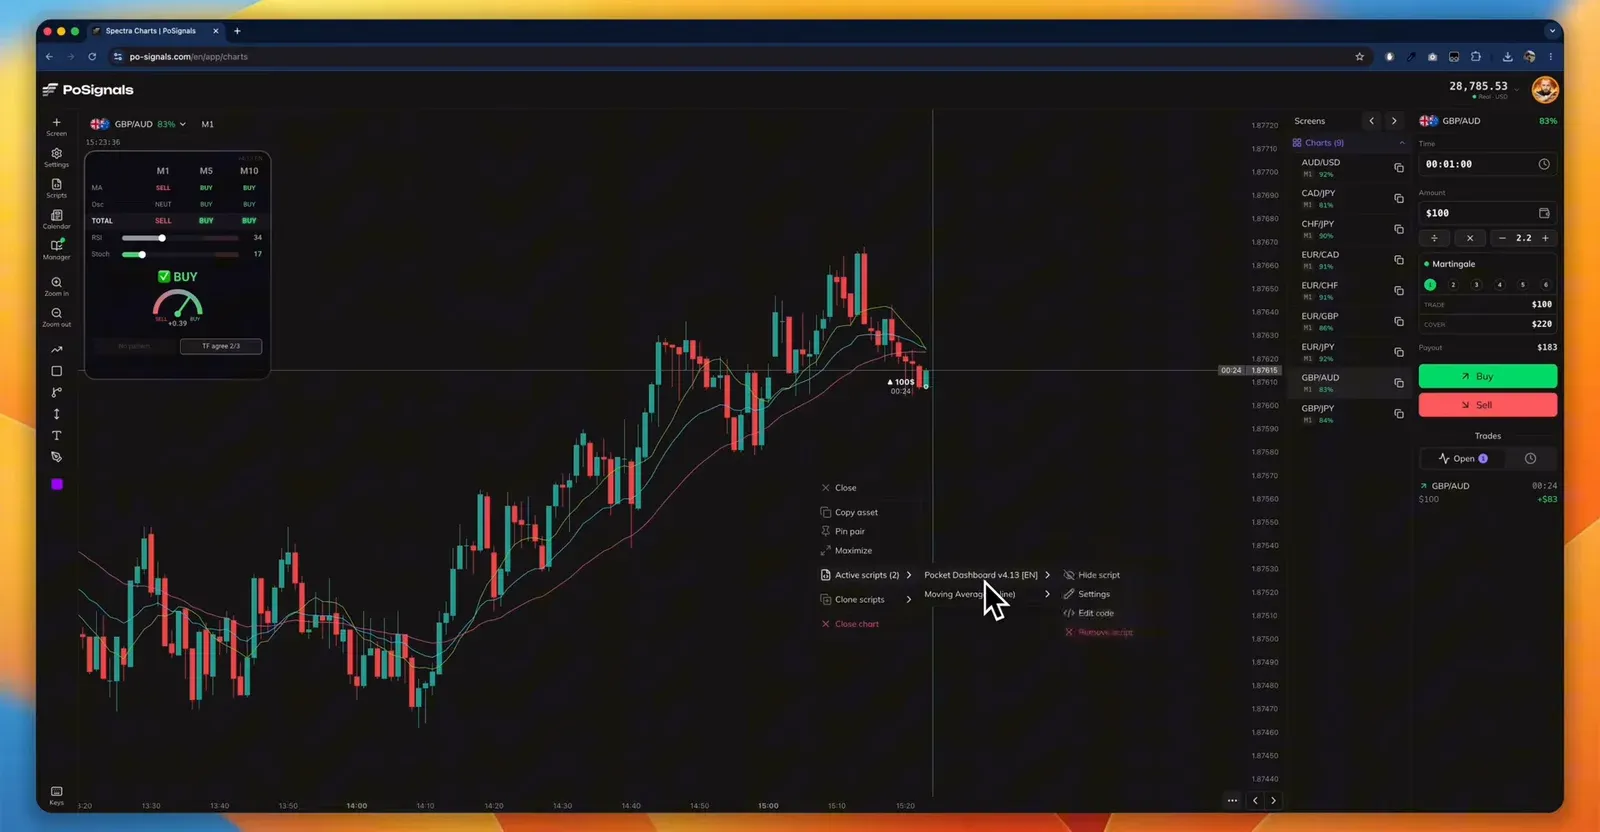
- EMA 50 for clarity: the Moving Average (3 line) indicator with only the first line enabled, period 50.
How to read the dashboard
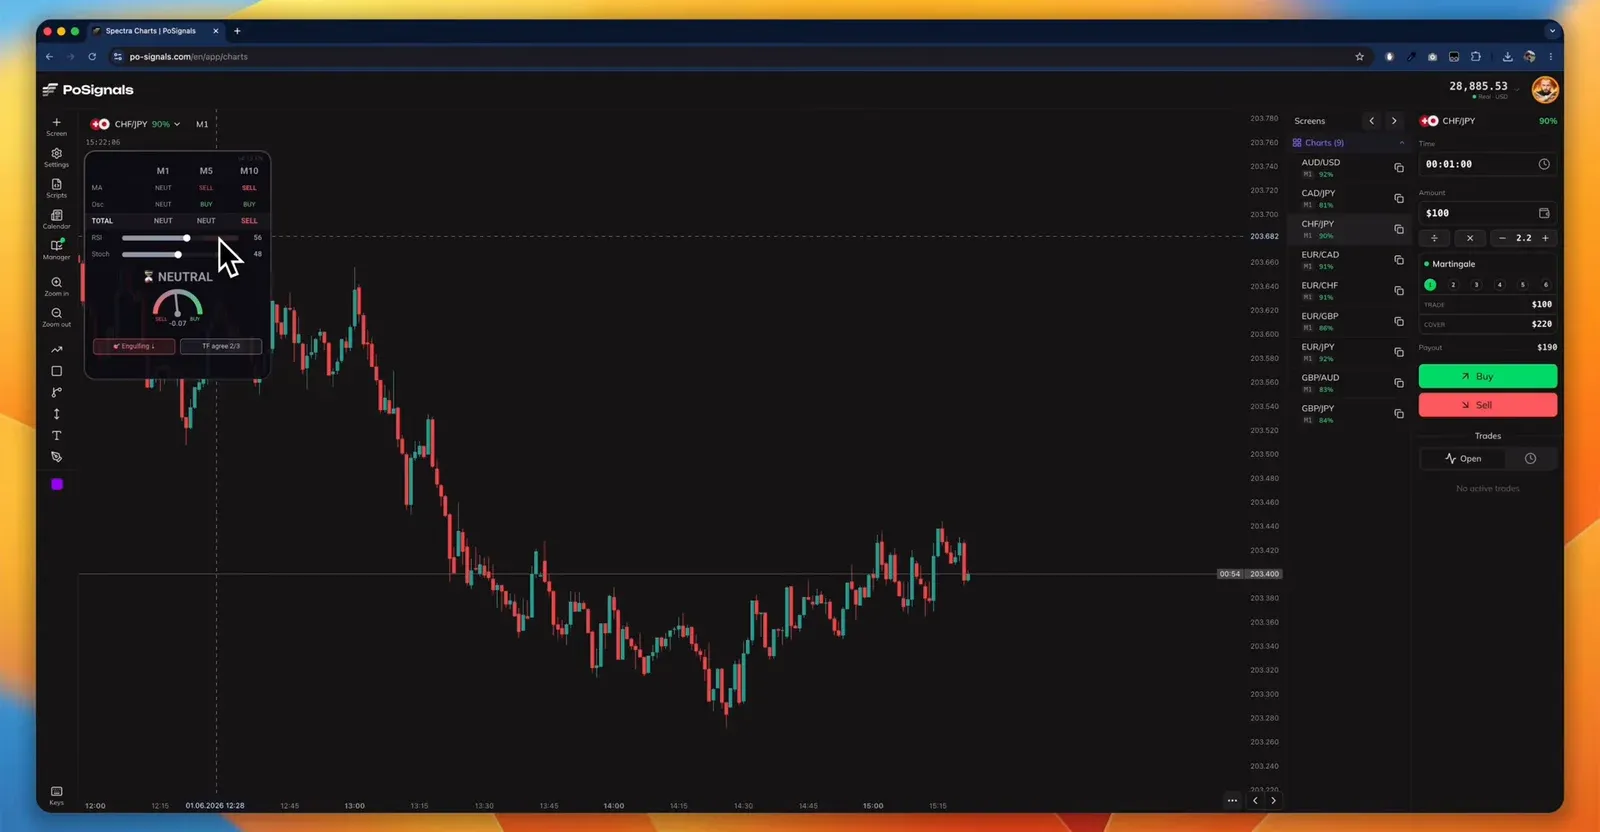
The widget in the chart corner is a three-by-three table: columns M1, M5, M10, rows "averages", "oscillators" and "total". Below are RSI and Stochastic sliders, a gauge needle with the current status and a "TF agree" label: how many of the three timeframes point the same way.
| Status | What the author does |
|---|---|
| Strong Buy / Strong Sell | looks for an entry in that direction |
| Buy / Sell | acceptable if M5 and M10 agree |
| Neutral | stays out |
Pocket Dashboard and other tools — in BinoView Supercharts
Entry rules
| Buy | Sell | |
|---|---|---|
| Status | Strong Buy, Buy | Strong Sell, Sell |
| Timeframes | M5 and M10 say buy; M1 may show a pullback | M5 and M10 say sell |
| Candle | entry after a red (corrective) candle | entry after a green candle |
| Trend | price above EMA 50 | price below EMA 50 |
| Entry | with a new candle, 1-minute expiration | same |
| Recovery | one per asset; after two losses in a row, another asset | same |
The point is the word "pullback": you buy not when everything is already rising, but after a red candle inside the rise, when price has retraced. The author considers an entry after a green candle his mistake, and in the video that is exactly where he takes a loss.
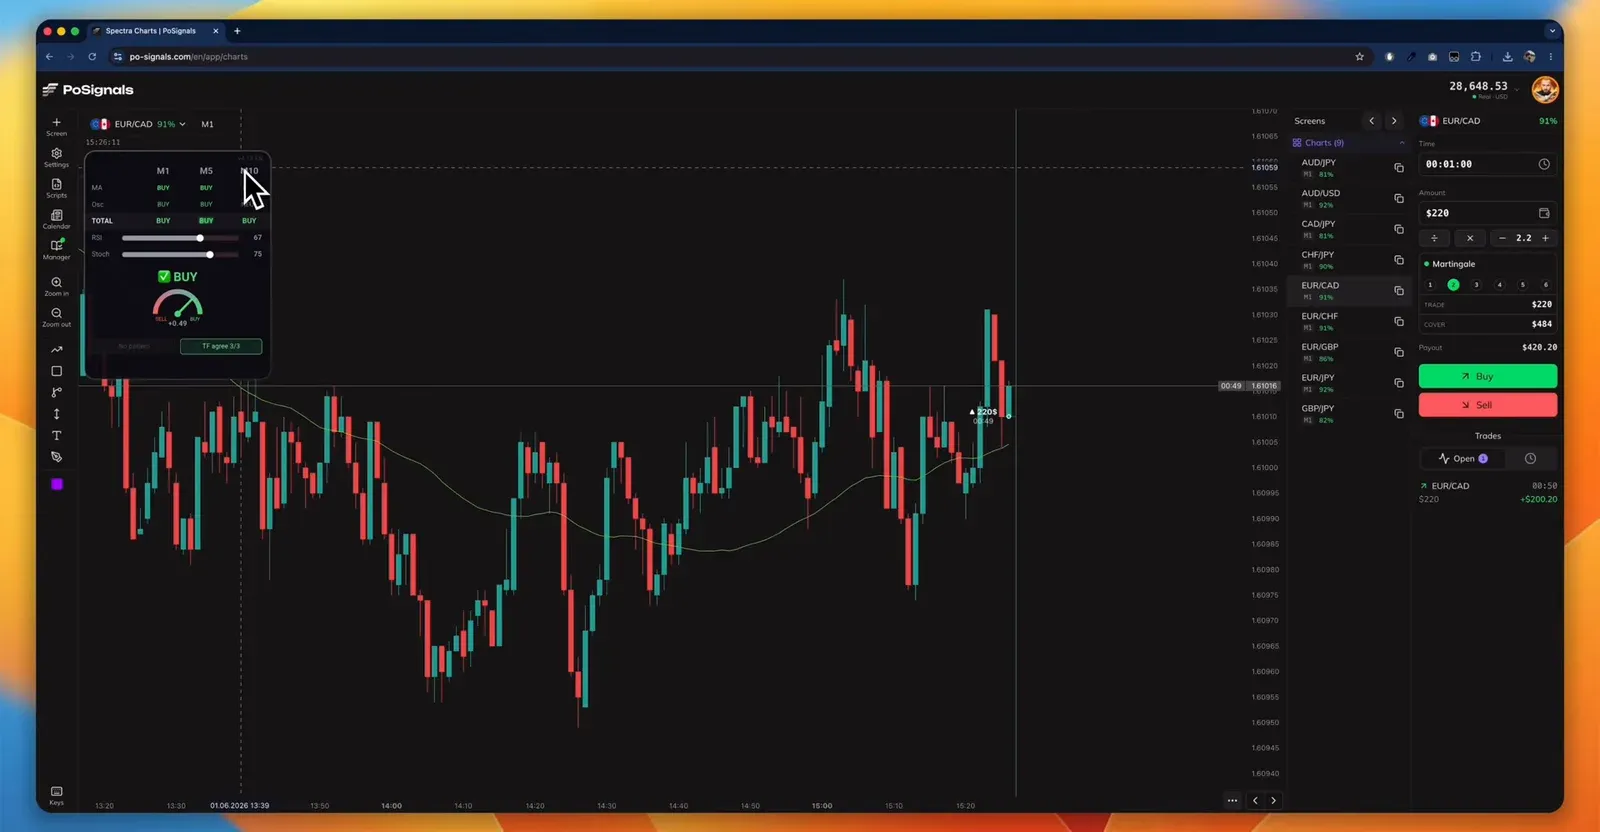
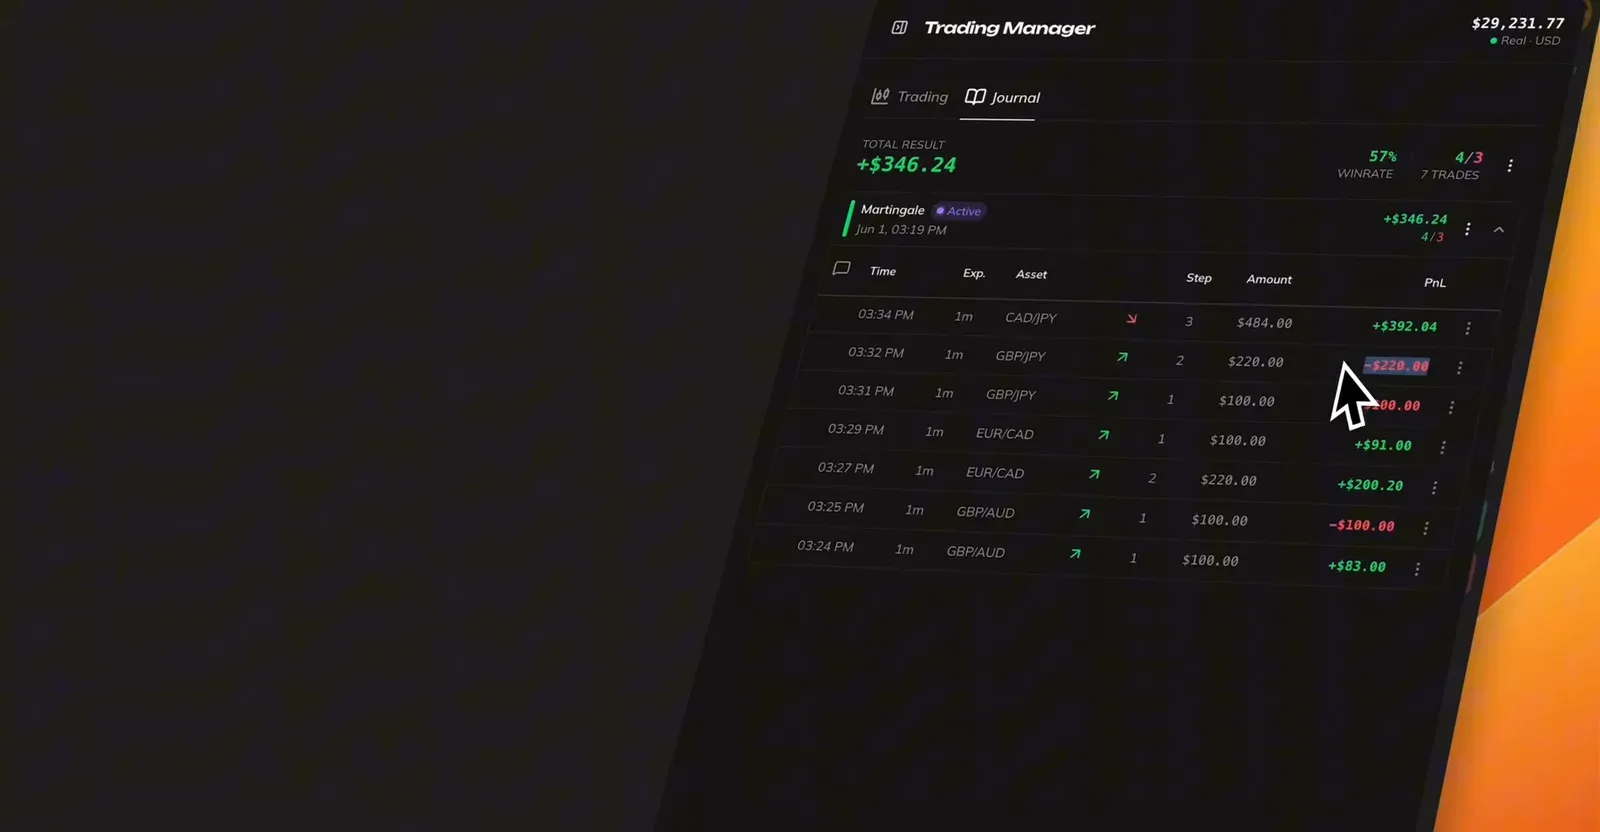
The session from the video, trade by trade
- GBP/AUD, buy $100 after a red candle with Buy on M5 and M10. Win, +$83.
- GBP/AUD, another buy $100 without waiting for a new candle, at a local low. Loss. The terminal will not let him open the recovery trade: the asset's payout has dropped, so the author moves to another chart.
- EUR/CAD, recovery trade $220: all three timeframes Buy, a new upward move after a deep pullback. Win, +$200.20.
- EUR/CAD, buy $100 after a red candle. A bearish engulfing pattern is on the chart, but with no levels nearby the author ignores it. Win, +$91.
- GBP/JPY, buy $100 after a green candle, breaking his own rule. Loss.
- GBP/JPY, recovery trade $220. Loss. Two losses in a row, switch asset.
- CAD/JPY, sell $484 on a support break in a strong downtrend. Win, +$392.04.
The result of the recording per the manager's journal: 7 trades, 4 wins and 3 losses, +$346.24. The author's comment: the win rate is not high, losses are unavoidable, and videos with endless wins are usually shot on demo.
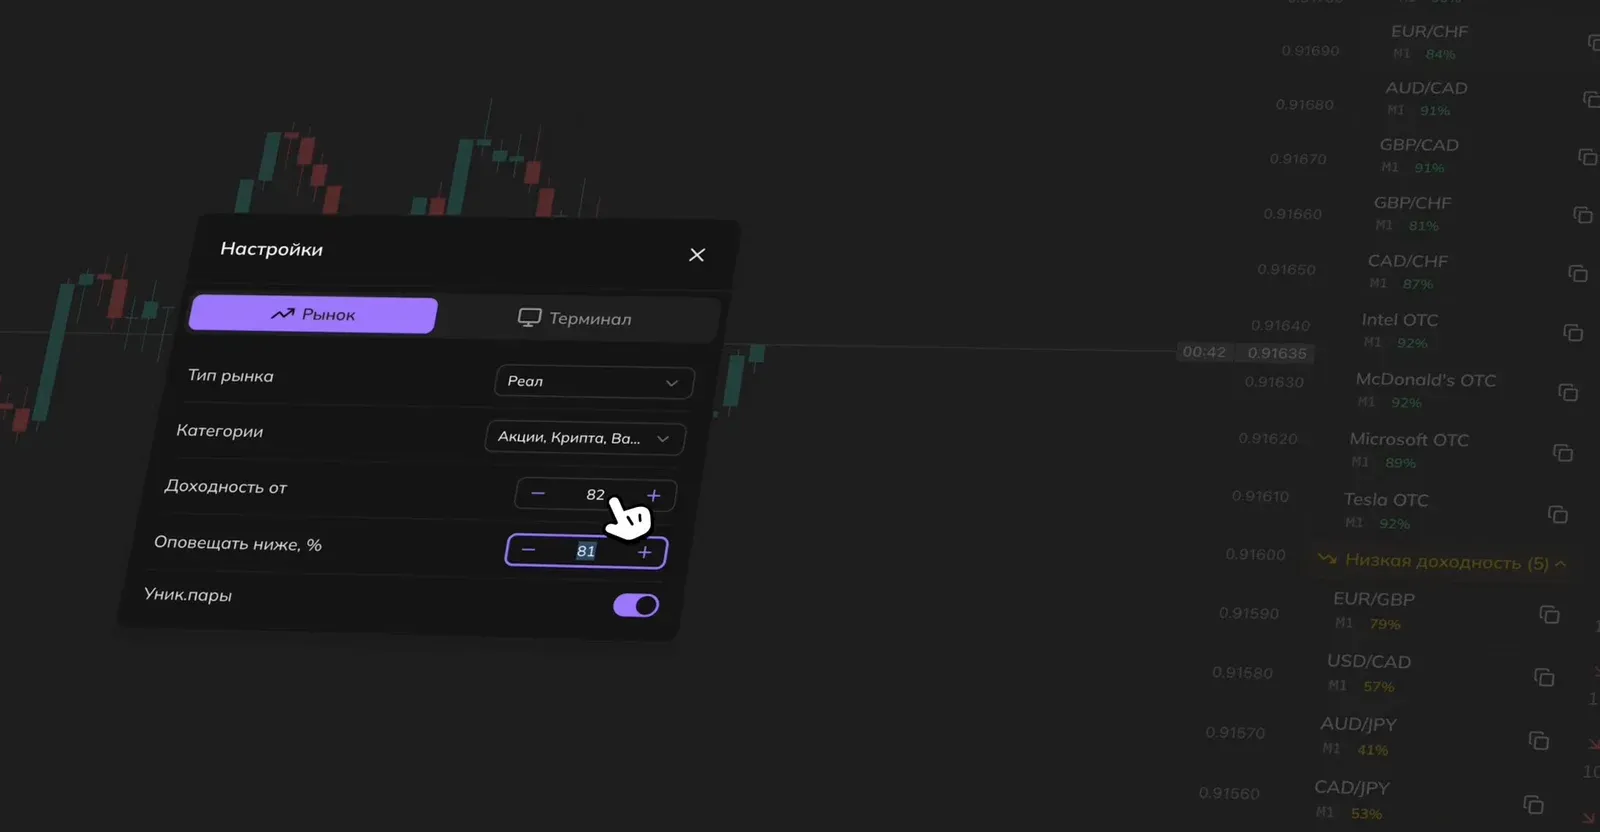
The 2-minute expiration variant
In the video of May 23, 2026 the strategy is shown on the same setup with different parameters. For the first session of that day, before the recording, the journal shows +₽98,229.
| Difference | Value from the video |
|---|---|
| Market type | "Real" in the terminal settings, payout from 82%, alert when it drops below 81% |
| Expiration | 2 minutes: on one minute price does not travel far enough |
| Timeframe agreement | all three: M1, M5 and M10 |
| Confirmation | the Stoch BB Reversal signal bot, Bollinger Bands and Stochastic |
| Ban | no entry at an outer Bollinger Band when Stochastic is overbought or oversold |
| Sideways | bands narrowing, candles at one level: no trades |
| After two losses | pause, no immediate recovery trade |
The logic is the same: the dashboard says "strong buy", but if price is already at the upper band and Stochastic is overbought, the author waits for a corrective candle or a retrace to the middle band. In the video he twice enters without waiting and both times calls it risky.
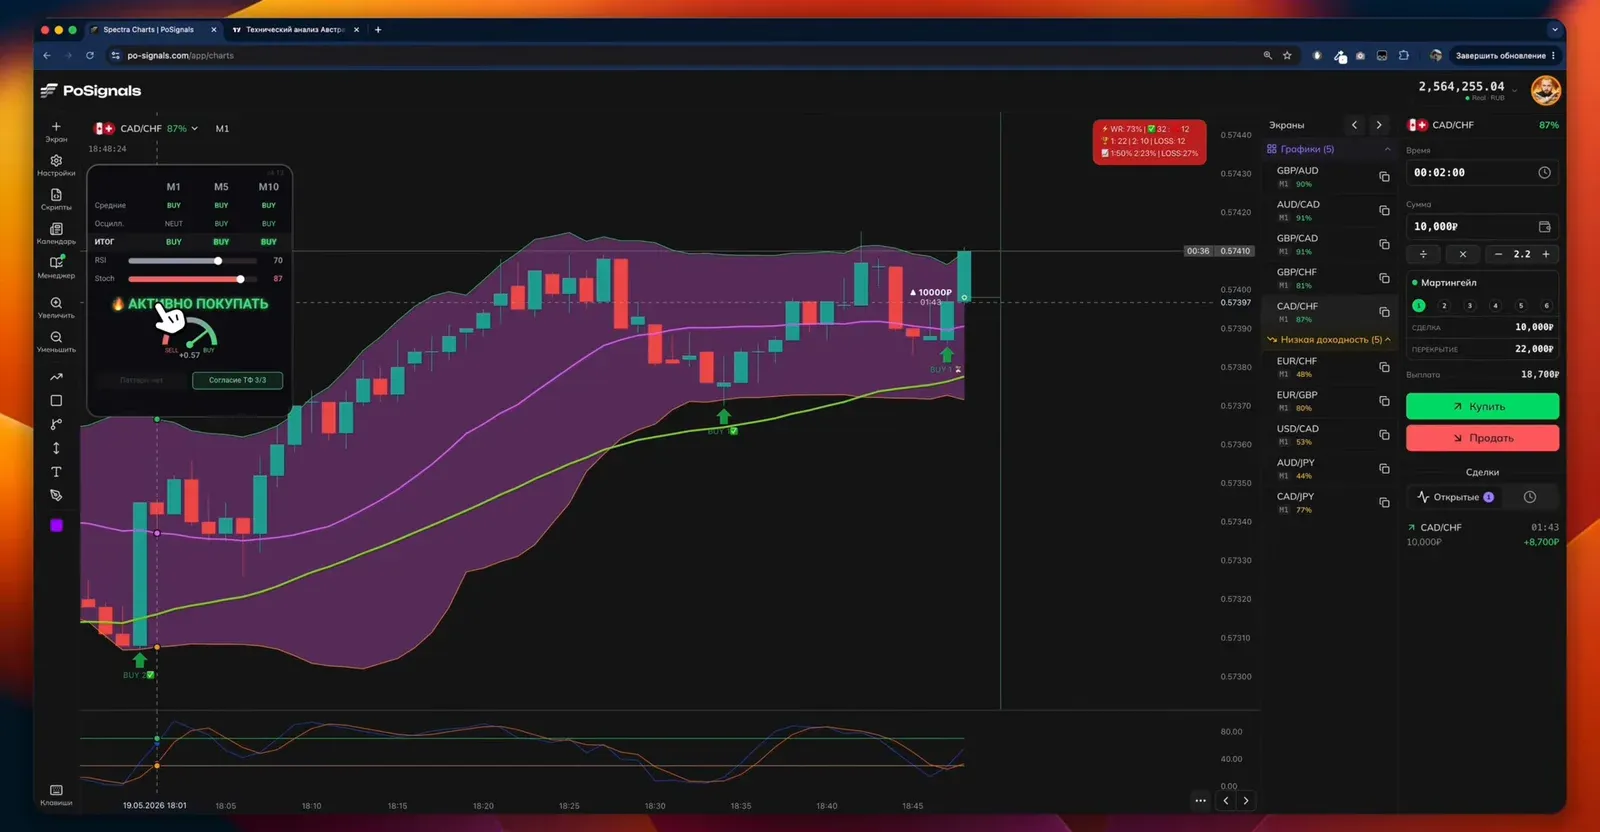
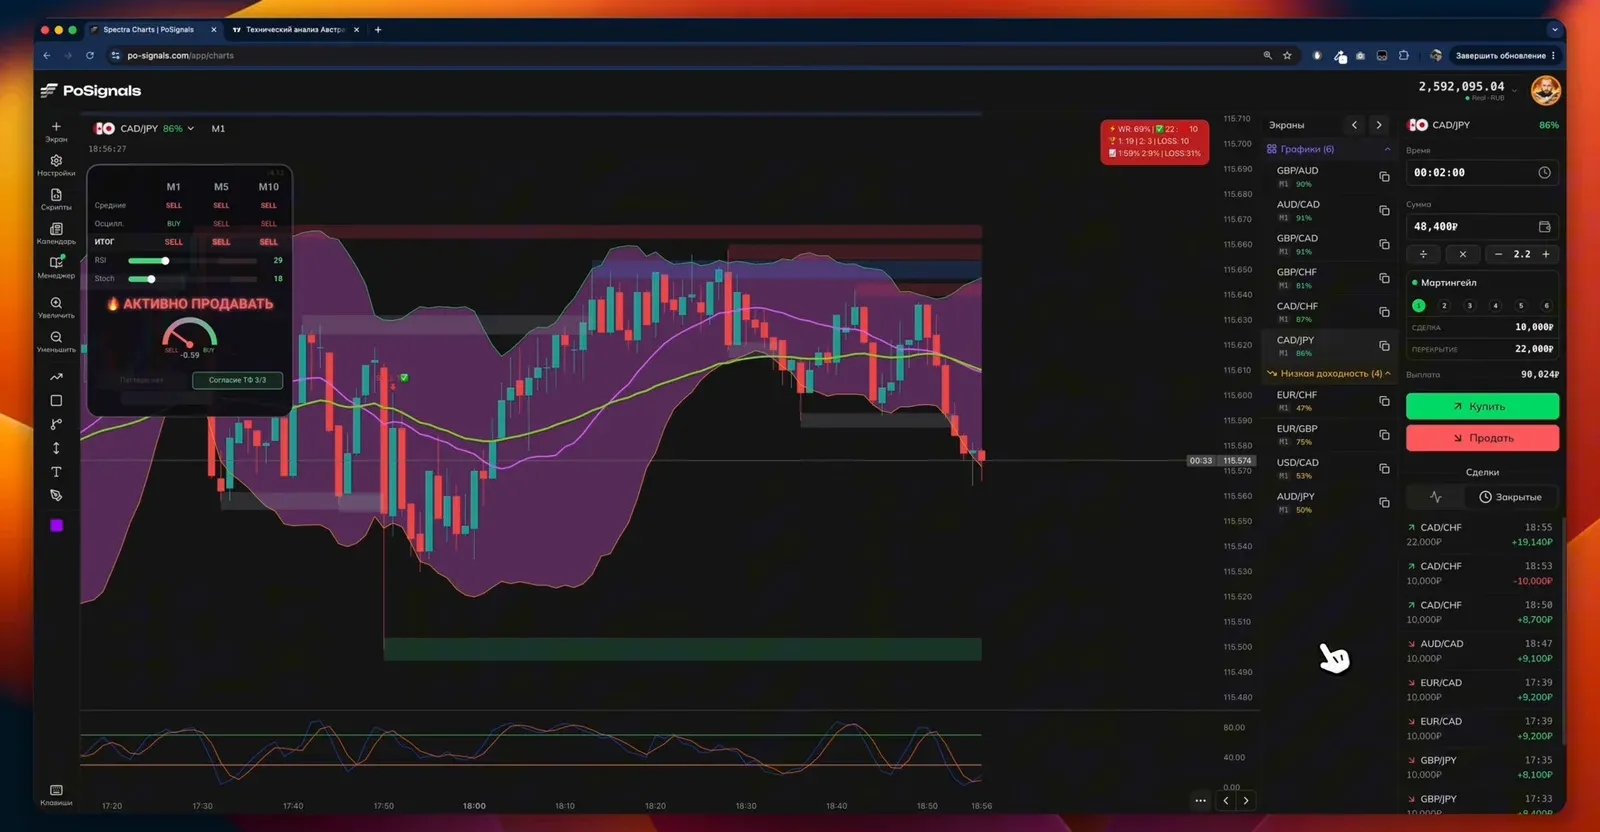
The result of the recording: three wins and one loss, +₽26,940.
Before you test it
- The dashboard is an indicator tool. It sums the readings of moving averages and oscillators and lags like they do. You still have to look at the chart.
- News. The "30 minutes before and after" rule applies in both videos.
- Losses are unavoidable. The author repeats it in every video: what matters is understanding the strategy and covering in time.
- Demo account. Compare both variants, 1-minute and 2-minute, on demo on your own assets.
FAQ
What does Pocket Dashboard show?
A technical analysis summary for three timeframes at once, like the 'Technicals' section on TradingView but inside the terminal. For M1, M5 and M10 the indicator tallies the votes of moving averages and oscillators and outputs a verdict: strong buy, buy, neutral, sell or strong sell.
Why is a buy opened only after a red candle?
A red candle in an uptrend is a pullback. Entering after it gives a better price and does not chase a move that has already left. The author does not buy after a green candle and in the video calls such an entry his own mistake.
Which Pocket Dashboard version should I pick in the catalog?
The video uses version 4.13 with default settings. A 'dashboard' search in the script catalog returns several versions reworked by partners: they differ in interface language and extra filters, while the reading logic is the same.