Fix Adaptive Bot Signals with Trend and Level Filters: a Pocket Option Strategy
A live session on the Fix Adaptive signal bot: adaptive expiration in bars, entry at the open of the signal candle when the first-trade win rate is 78% or higher, Adaptive Trend Finder and Support & Resistance Signals as filters, one recovery trade per asset, bot recalculation and a breakdown of four trades from the video.
Contents
The video is meant as an answer to those looking for a "magic button" in bots: a live session on the Fix Adaptive signal bot with no editing, explaining what the card means, why the first trade is the one to take and which indicators the author lays over the signals as filters. The result of the recording is modest, three wins and one loss, but you can see how the decisions are made.
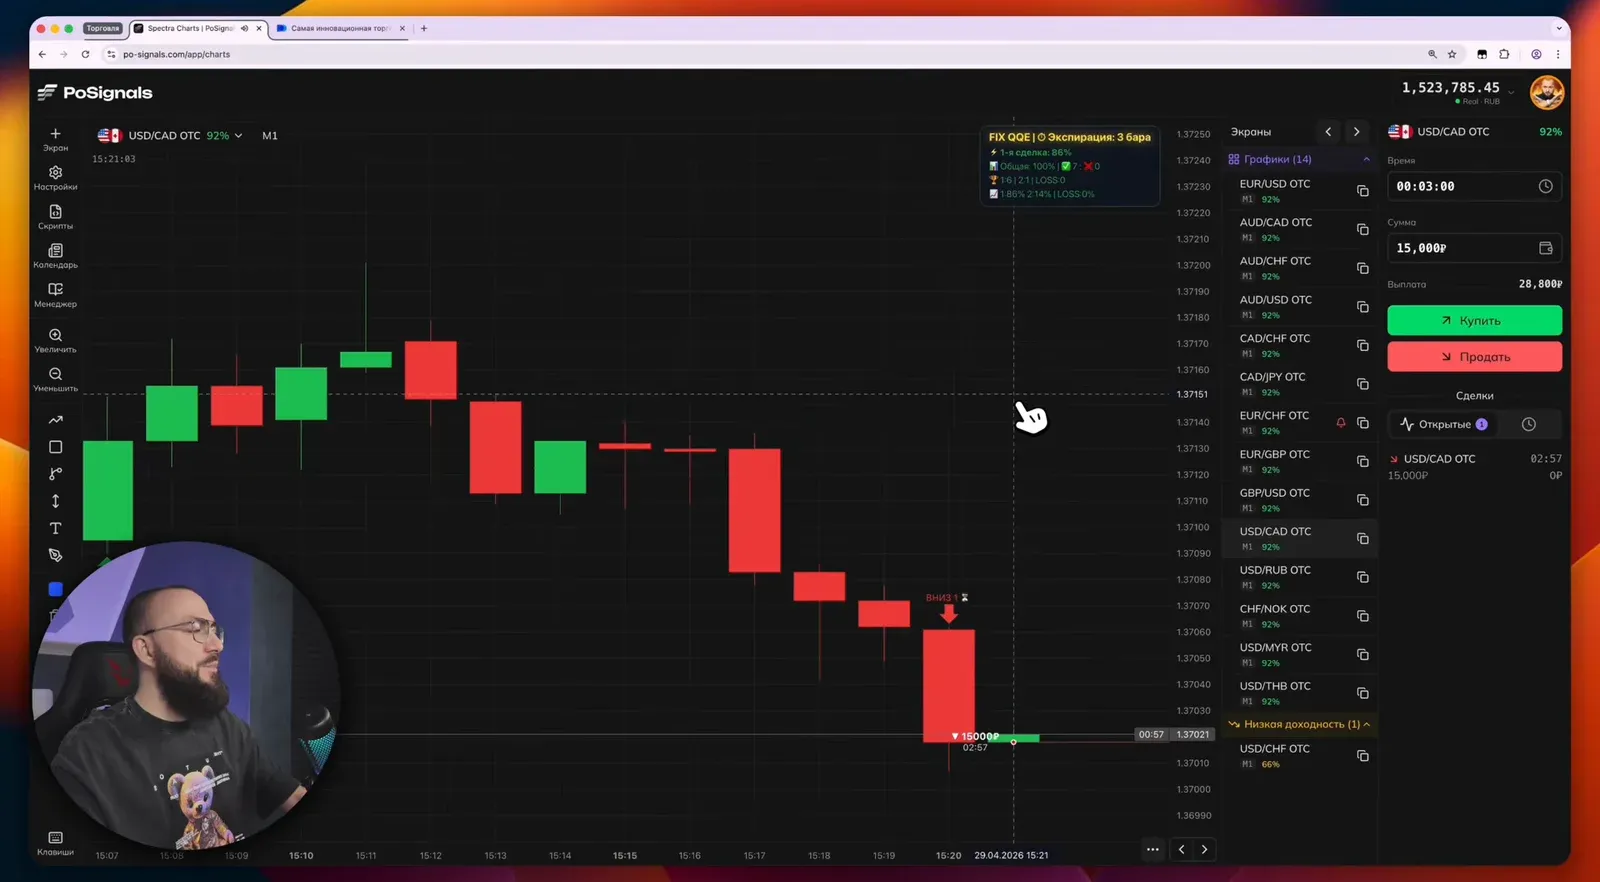
How to read the bot's card
Fix Adaptive is an adaptive bot: it tries strategy and expiration variants on every asset and shows the best one in its card. Expiration is set in bars because one bar equals one candle of the current timeframe, and the bot is built for M1–M5.
| Card row | Meaning |
|---|---|
| Expiration: 3 bars | how many candles a trade on this asset lasts right now |
| 1st trade: 86% | the share of first-attempt wins, the key number for the author |
| Overall: 100% | the win rate including recovery trades; the bot counts up to three attempts |
| ✓ and ✗ | how many setups closed as wins and losses |
| Percentages by step | calculated profit at each attempt and the loss of the series |
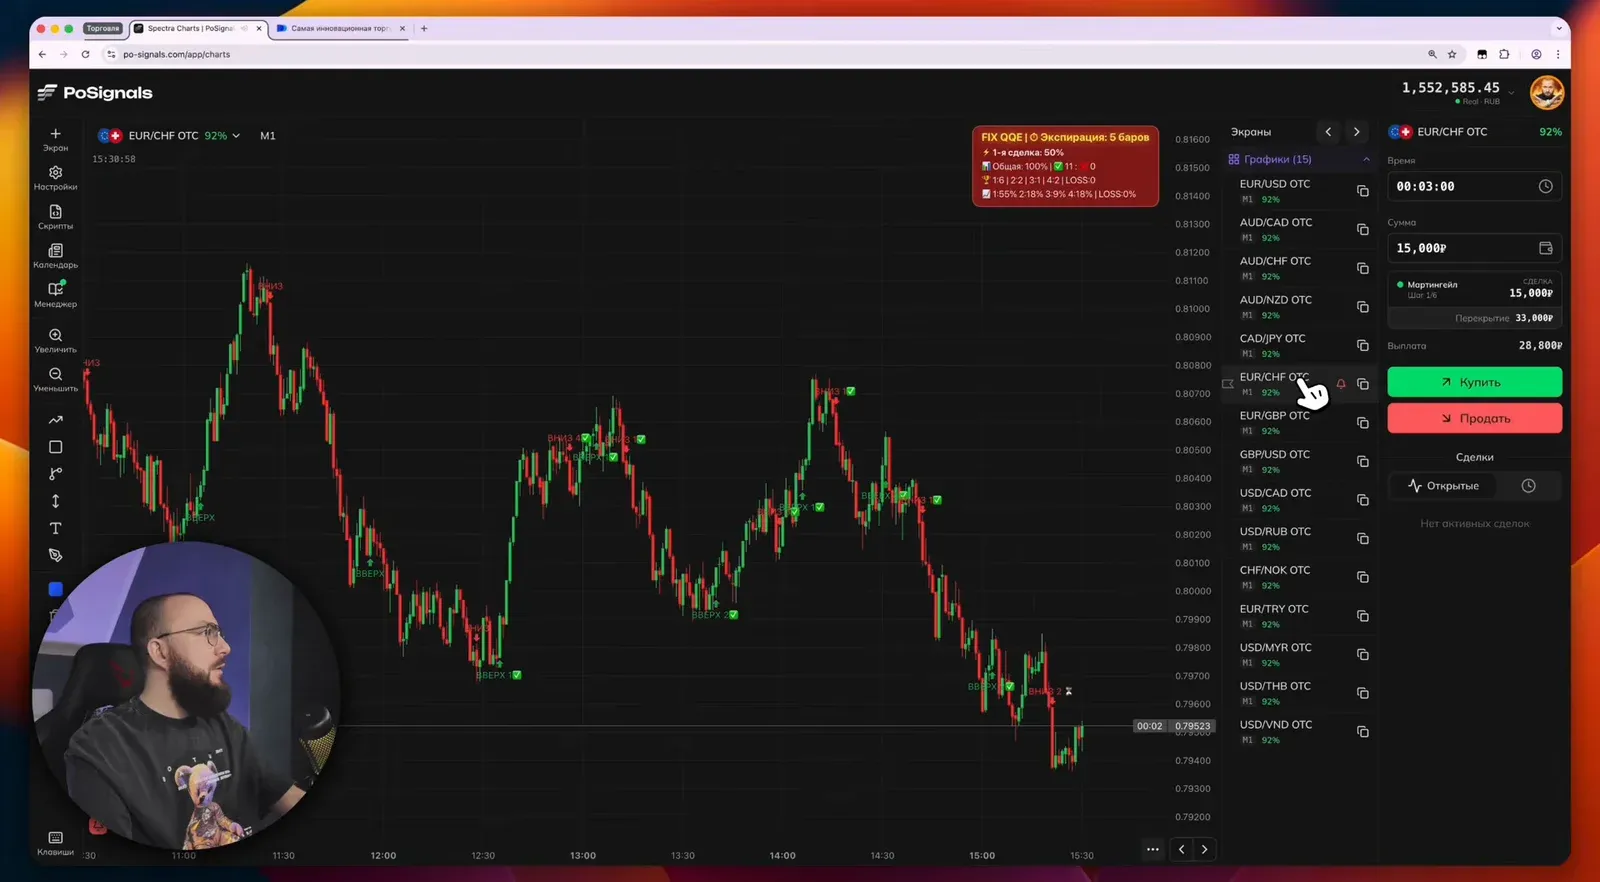
A red frame around the card means a low first-trade win rate; the author ignores such signals. Expiration differs across assets: one bar, three, five.
Entry rules
- Enter at the open of the signal candle for the expiration shown on the card: 3 bars on M1 is a 3-minute trade.
- First-trade win rate threshold: 78%. In the video the author also takes 69% to avoid waiting and says so himself: below the threshold a loss is more likely.
- Low asset payout or a red frame: skip.
- One recovery trade per asset. The bot counts statistics up to three attempts; the author takes the first trade and one recovery trade so as not to get stuck in a drawn-out move.
- Signal gone before the candle opens: no entry.
- M1–M5 only. On higher timeframes the bar-based calculation loses its meaning.
Fix Adaptive and other tools — in BinoView Supercharts
Filters: trend and levels
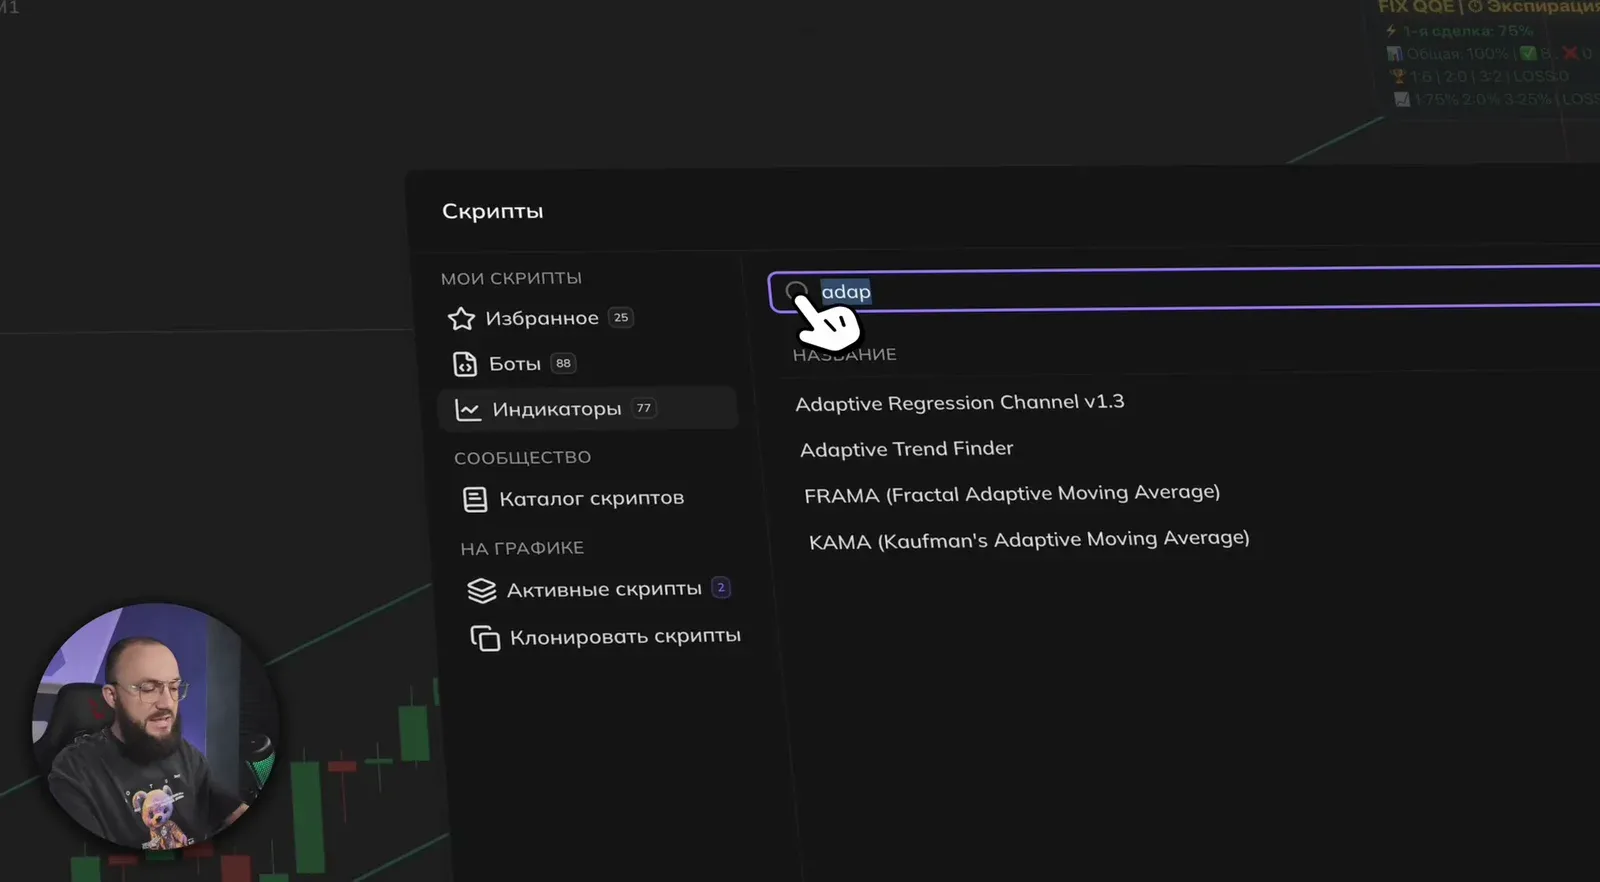
So that the bot "does not catch market noise", the author adds two indicators from the catalog: Adaptive Trend Finder for sloped trendlines and Support & Resistance Signals, of which only the levels are needed, with signals off.
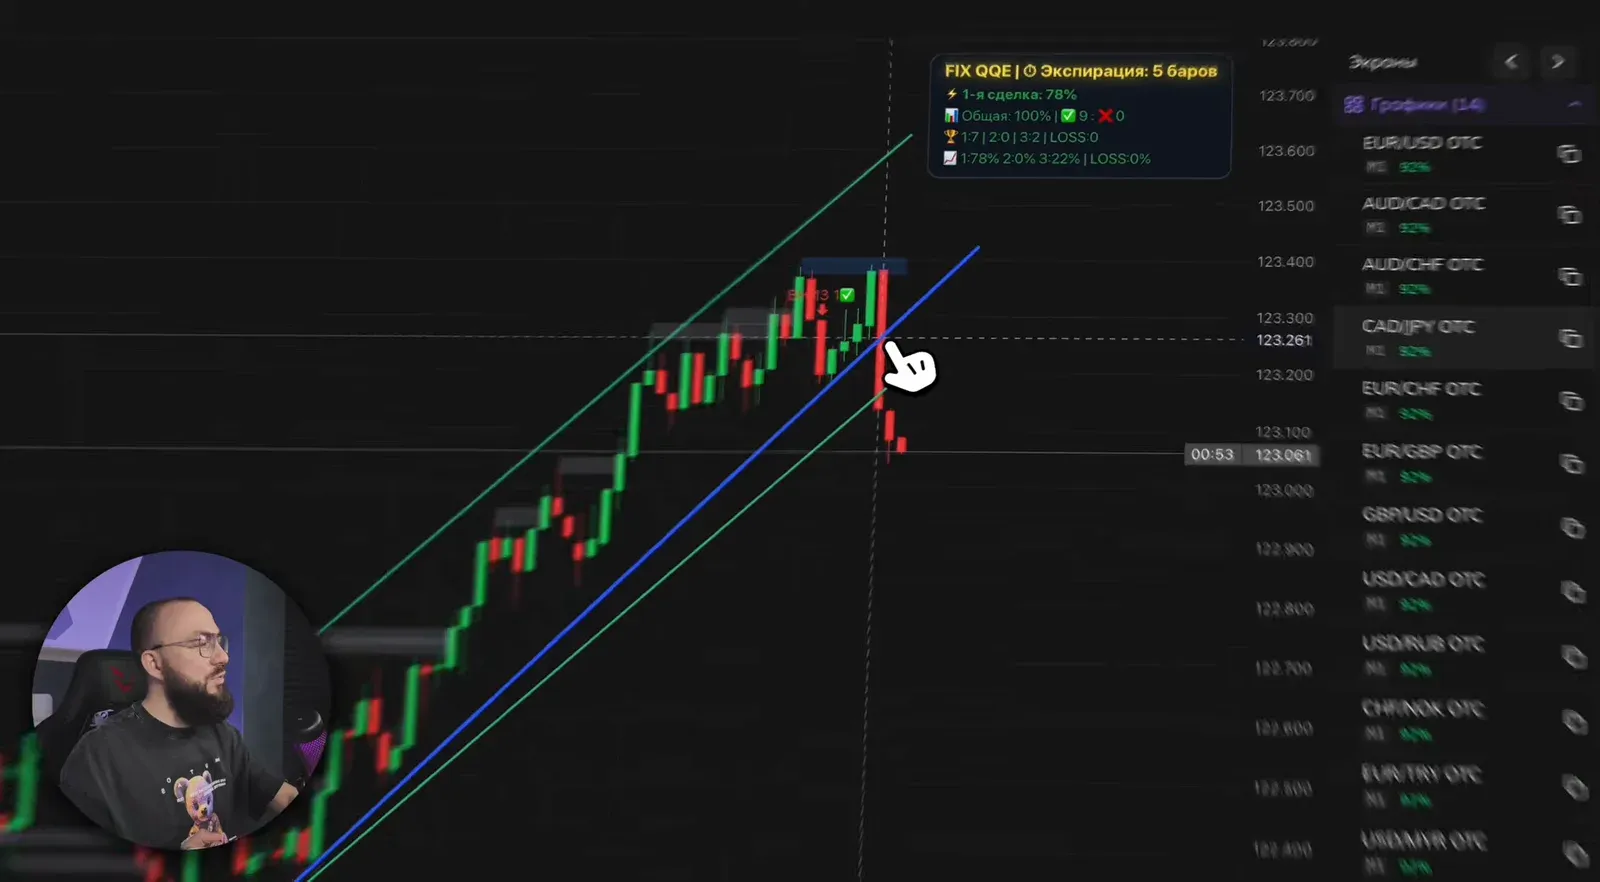
- Skip signals against a prolonged trend. A sell signal after a long rise is taken less readily than one with the trend.
- At an extreme with no levels, both directions are dangerous. If price is at a thousand-candle high and there are no levels above, the continuation can keep flying and a reversal may not start.
- A blue level means the bounce already happened. A trendline break after a bounce off resistance is a sign of a reversal or a pullback, and such a signal is taken with more confidence.
- A false break of support is a frequent reason a recovery trade wins: price pierces the level and comes back.
Trade manager
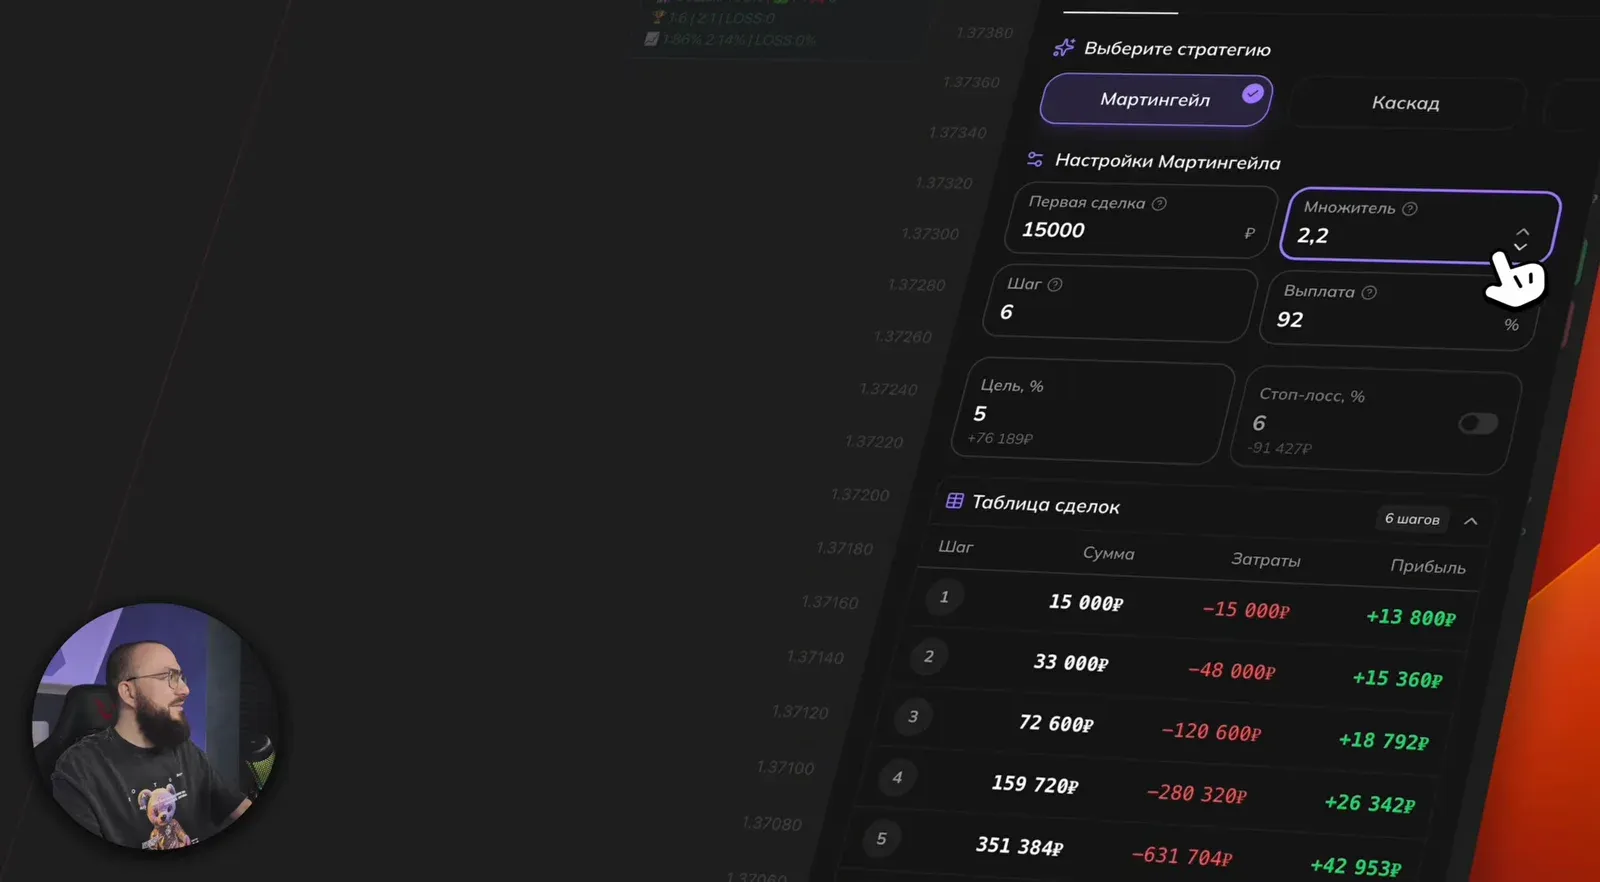
In parallel the manager runs in martingale mode: first trade ₽15,000 (1% of the deposit), multiplier 2.2, six steps, payout 92%, target 5%. The manager fills in the recovery amount and logs trades to the trader's journal; the first trade the author enters by hand because he started the session after the entry.
Recalculating the bot
If the bot has been open for a while and assets with a dropped payout have moved to the lower list, the author advises recalculating the strategy:
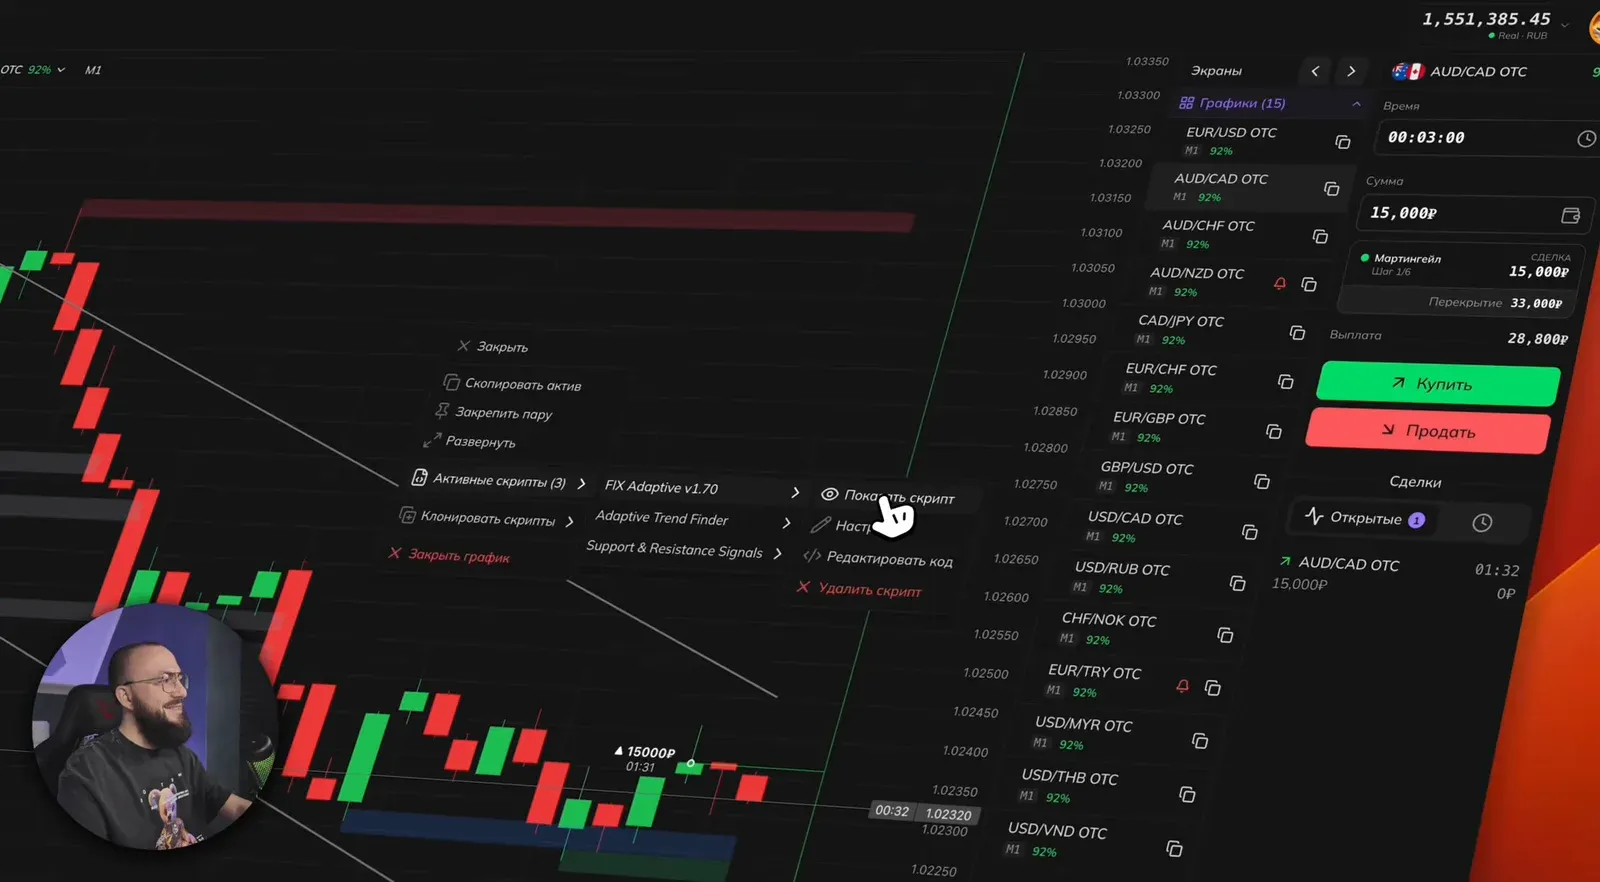
- Mass-switch the assets with the arrows on the screens panel. If the switch happened, the bot has recalculated on the new pairs.
- Hide and show the script again: right-click the chart (long press on a smartphone) → "Active scripts" → Fix Adaptive → "Hide script", then show it. The bot re-runs its strategies.
The session from the video, trade by trade
- USD/CAD OTC, sell for 3 bars. First trade 86%, overall 100%. A win by a single pip; in the author's words, "we squeaked through".
- CAD/JPY OTC, sell for 5 bars against an uptrend from the high, no levels above. The author enters deliberately, as an experiment. A win in the final seconds.
- AUD/CAD OTC, buy for 3 bars from support with the trendline pointing down, first trade 69%. Loss: support is broken.
- AUD/CAD OTC, recovery trade ₽33,000 for 3 bars at the open of a new candle. Win: the break turned out false and price returned above the level. The card's overall win rate after recalculation is 92%.
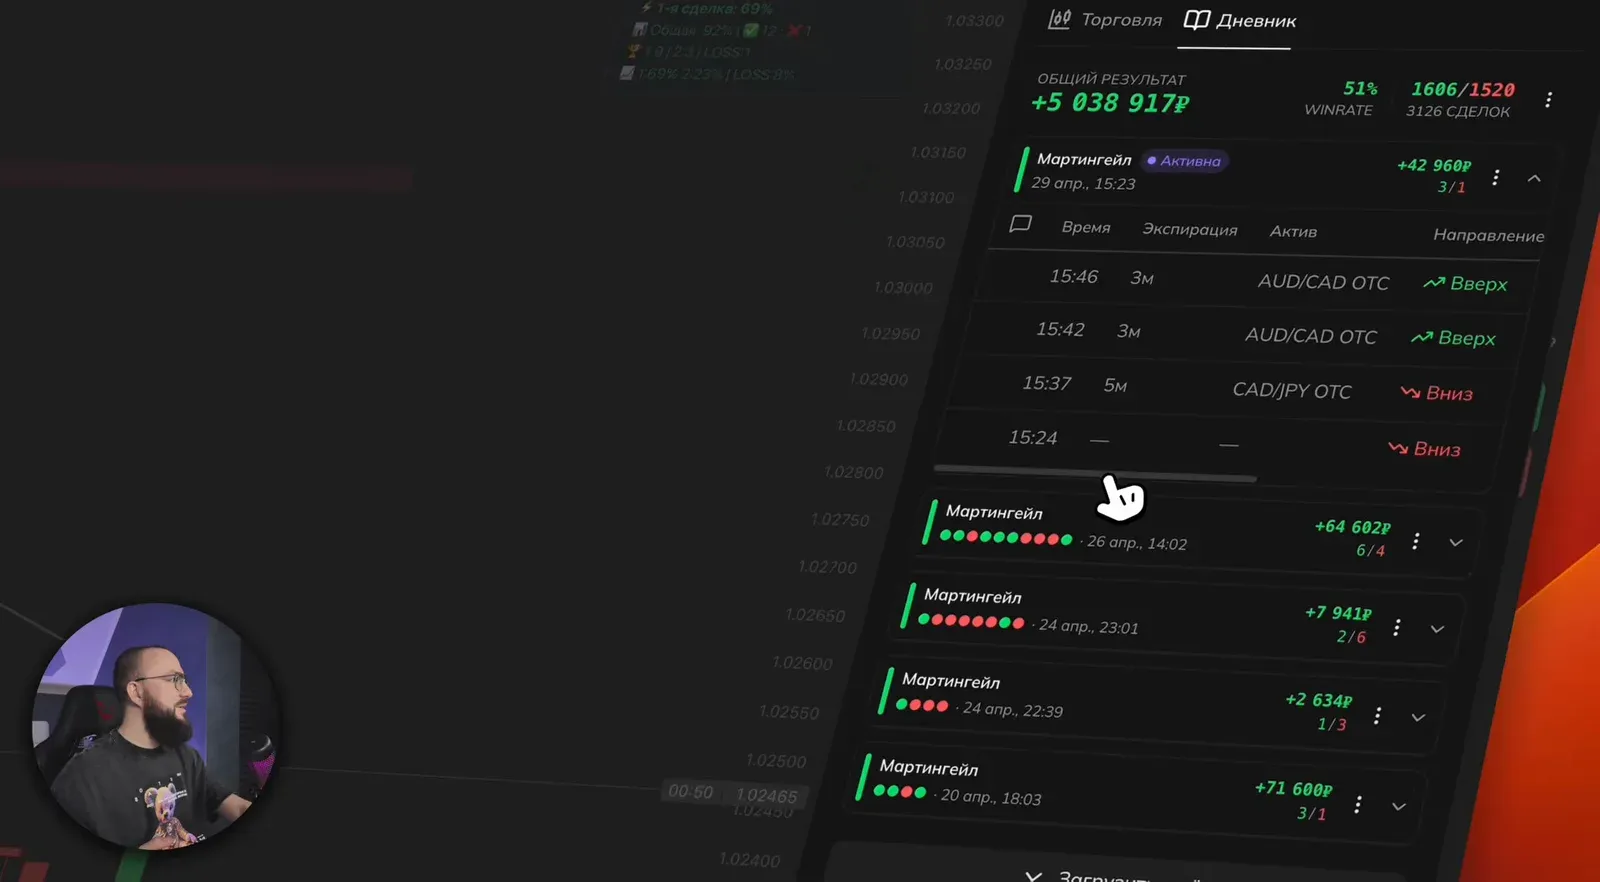
The result of the recording: 4 trades, 3 wins and 1 loss, +₽42,960 with a first trade of 1% of the deposit. The same screen shows the journal's overall statistics: 3,126 trades at a 51% win rate. The profit comes from recovery trades, not entry precision, and the author does not hide it.
Before you test it
- Statistics are computed on the past. The author says it twice: 100% on the card does not mean it will stay that way.
- OTC assets. The session is recorded on OTC, where quotes are synthetic; see the OTC article.
- Do not chase a low win rate. The 69% was taken for the sake of the recording; the working threshold is 78%.
- Demo account. Learn to read the card and the filters first, then the real account.
FAQ
Why is the bot's expiration set in bars rather than minutes?
One bar equals one candle of the current timeframe: '3 bars' on M1 is 3 minutes, on M5 it is 15. The bot tries expirations from 1 to 5 bars and shows the one with the best statistics on that asset.
What if the bot has been open for a while and the signals got worse?
Recalculate the strategy: hide and show the script again through the active scripts menu, or mass-switch the assets. The bot will re-run its options and pick the best one for the current market.
Which timeframes does Fix Adaptive work on?
M1 to M5; it is a scalping bot. On M10, M15 and higher the bar-based calculation turns into hours-long expirations, and the statistics stop being relevant.