Bollinger Bands + Stochastic + EMA 50 Binary Options Strategy for the 1-Minute Chart
A trend-following binary options strategy on the 1-minute chart: Bollinger Bands (20, 2), Stochastic (5, 3, 3) and EMA 50 settings, entry conditions after a pullback, a win-rate filter and a trade-by-trade breakdown of the session from the video.
Contents
In this video Nick shows a trend-following strategy built on three standard indicators that he trades himself. Bollinger Bands define how far a pullback goes, Stochastic marks the end of the pullback, and EMA 50 keeps you from entering against the trend. Below are the rules, settings and a breakdown of the trades from the video in text form, so you can come back to them without scrubbing through the recording.
The idea in short
This is not a reversal strategy. It looks for a trending move, waits for a pullback inside it and enters when the corrective impulse fades and price resumes the trend. Each indicator answers one question:
- EMA 50 — which way is the trend. No trades against it.
- Bollinger Bands — how far the pullback went. Touches of the middle band or of the band opposite to the trend are what matters.
- Stochastic — is the pullback over. Only crosses above 70 or below 30 count.
Timeframe M1, expiration 1 minute. The trade opens with a new candle.
Indicators and settings
| Indicator | Settings from the video | What it does |
|---|---|---|
| Bollinger Bands | period 20, deviation 2, all three lines on, middle line thicker | the corridor the pullback returns to |
| Stochastic Oscillator | %K 5, %D 3, slowing 3, SMA smoothing, levels 70 and 30 | the moment the pullback ends |
| Moving Average (3 line) | only line 1 enabled: EMA with period 50, other lines off | trend direction |
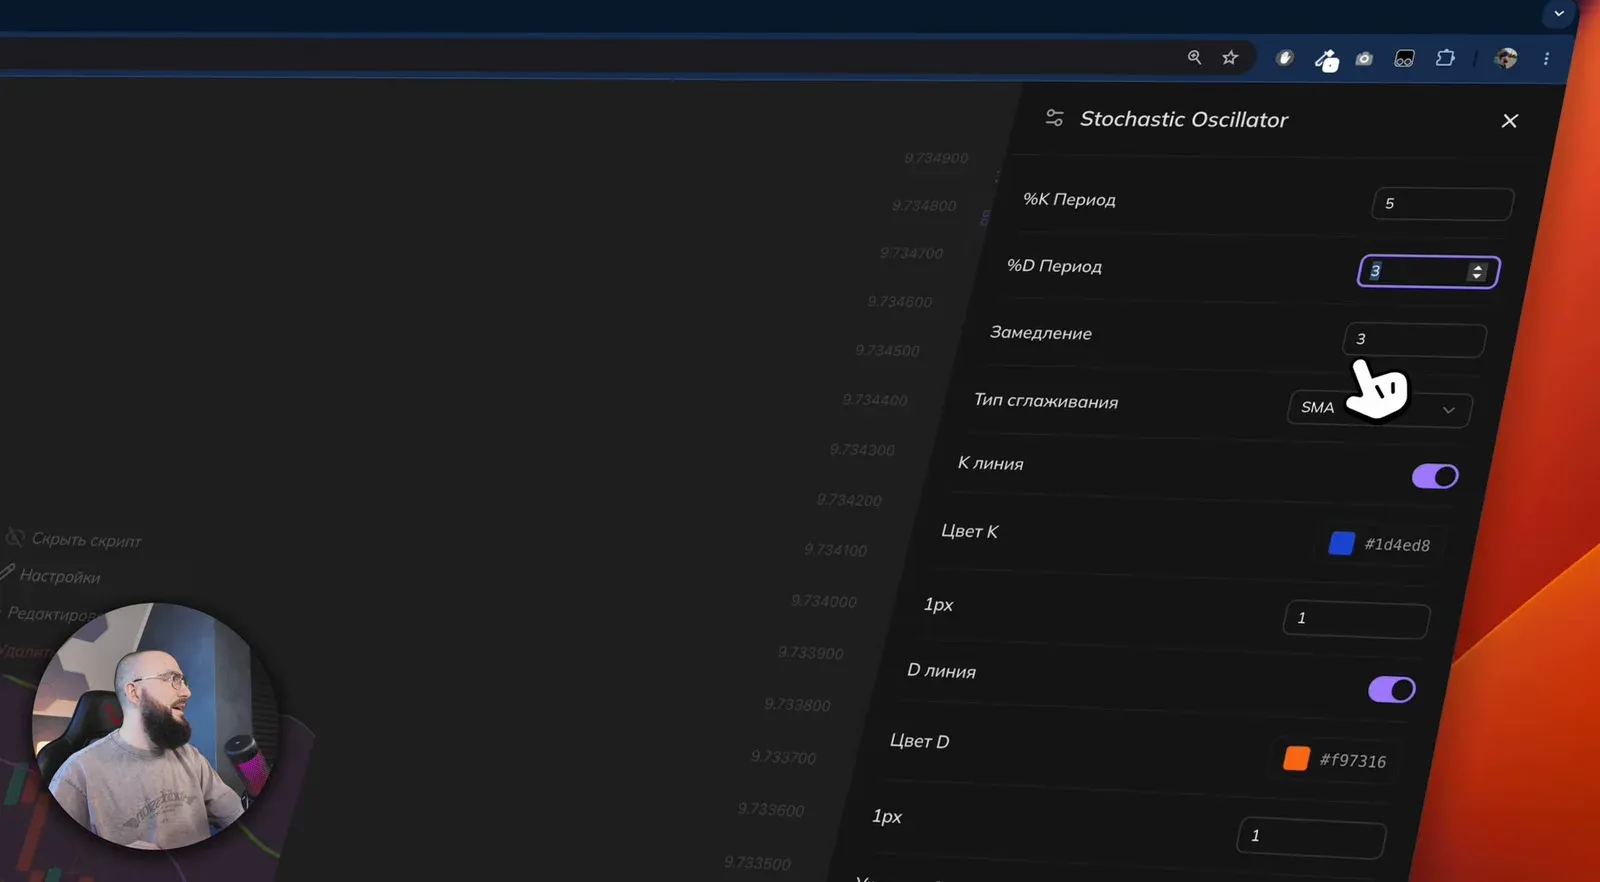
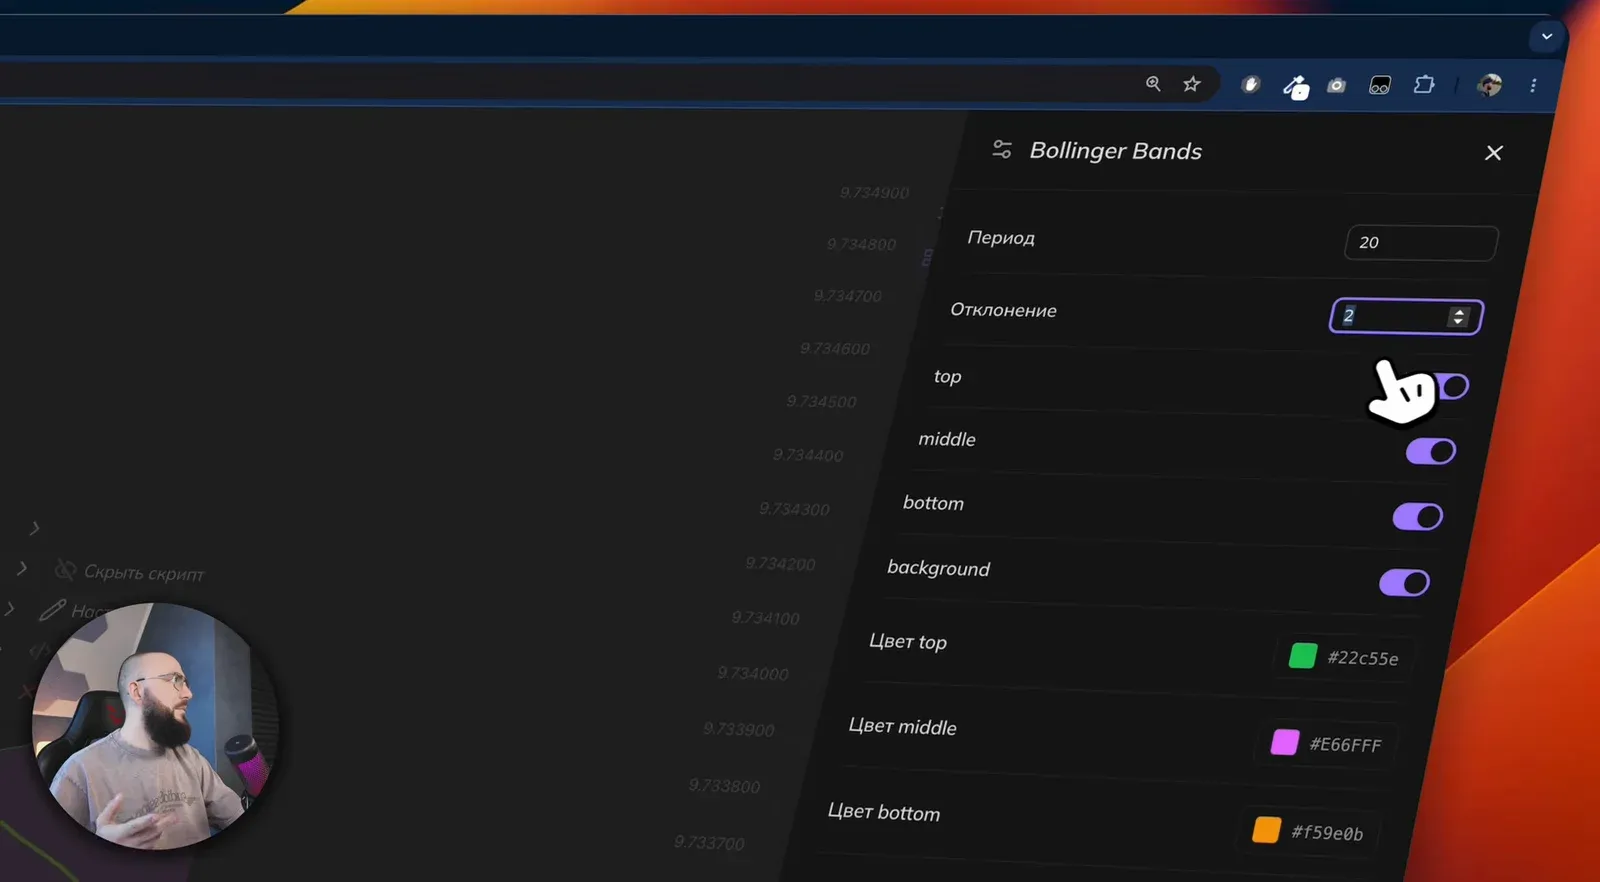
All three indicators are available in the BinoView Supercharts script catalog and in the standard Pocket Option toolset, so the strategy is not tied to a particular terminal.
Stoch BB Reversal and other tools — in BinoView Supercharts
Entry rules
| Buy | Sell | |
|---|---|---|
| Trend | EMA 50 points up | EMA 50 points down |
| Pullback | price pulled back to the middle or lower Bollinger Band | price rose to the middle or upper band |
| Signal | Stochastic crossed below 30 and is turning up | Stochastic crossed above 70 and is turning down |
| Entry | with a new candle, 1-minute expiration | with a new candle, 1-minute expiration |
Stochastic crosses between 30 and 70 are ignored entirely: that is noise inside the pullback, not its end. A touch, a break or simply a candle sitting at a Bollinger line all count the same; the zone matters, not the exact touch.
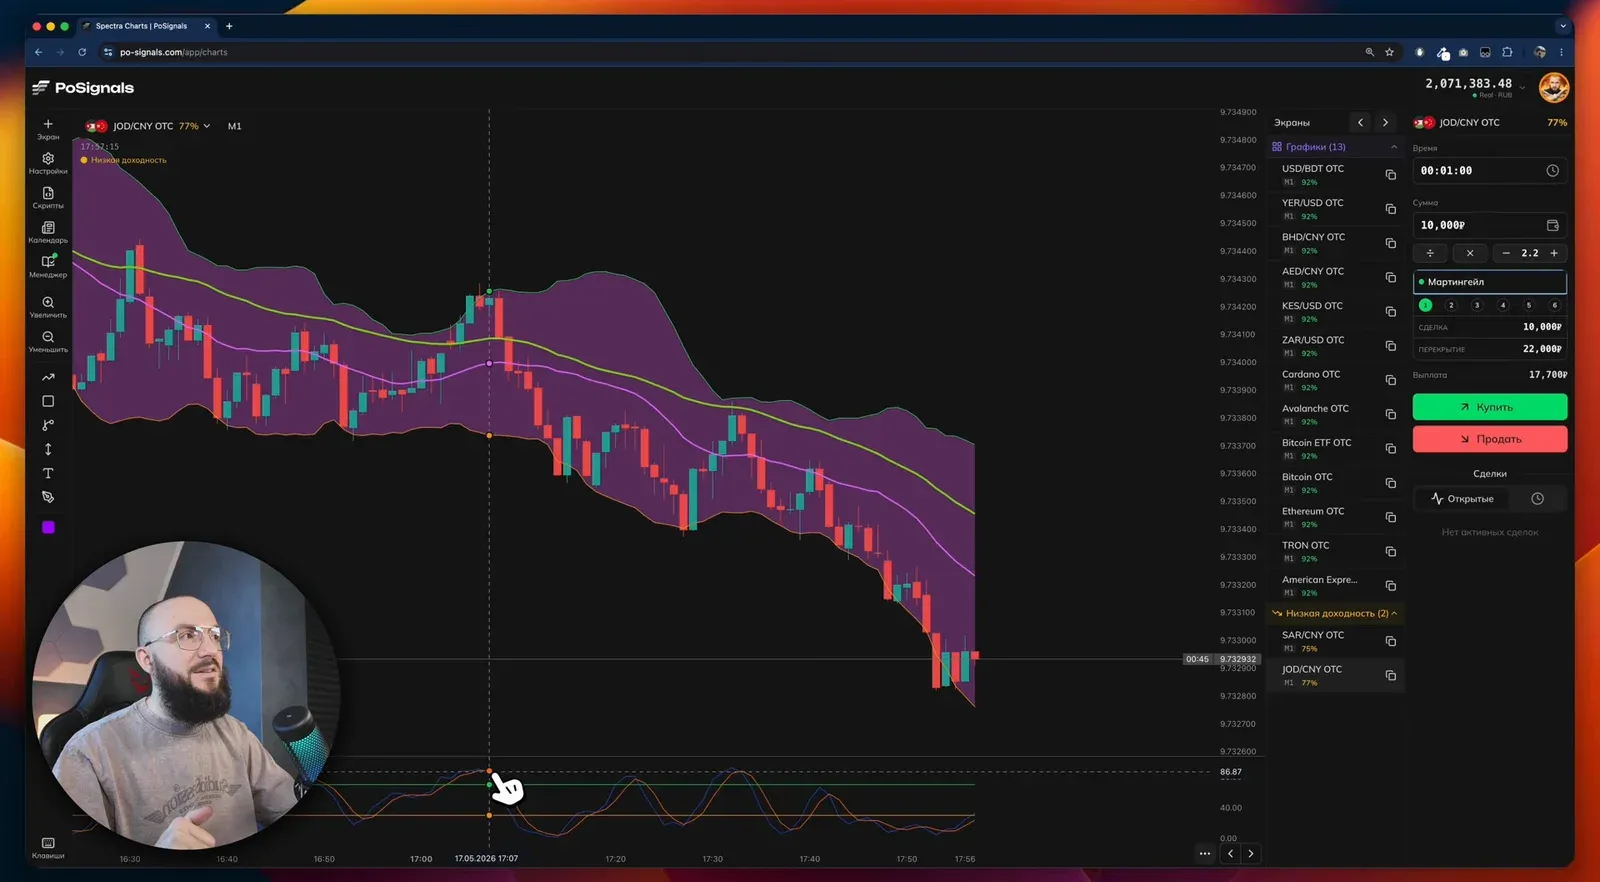
The frame above is the teaching example of a sell from the video: price touched the upper band, the Stochastic crossed beyond 70, the green EMA is heading down. Three conditions met, the trade opens down.
The Stoch BB Reversal helper bot
Keeping three conditions in your head while flipping through fifteen charts is tiring, so the script catalog has a bot called Stoch BB Reversal v1.1 built for this exact strategy. Its defaults are Stochastic 5/3/3 with 70/30 zones and a Bollinger Bands 20/2 filter. The bot marks setups on the chart, keeps a statistics card and plays a sound alert.
Settings the author changes after installing it:
| Parameter | Value | Why |
|---|---|---|
| Card: alert when WR below | 75% | signals with a lower win rate are skipped |
| Expiration N (bars) | 1 | one 1-minute candle per trade |
| Number of recovery steps | 1 | no more than one recovery trade per asset |
| Bollinger Bands filter | on | without it the bot catches every Stochastic cross |
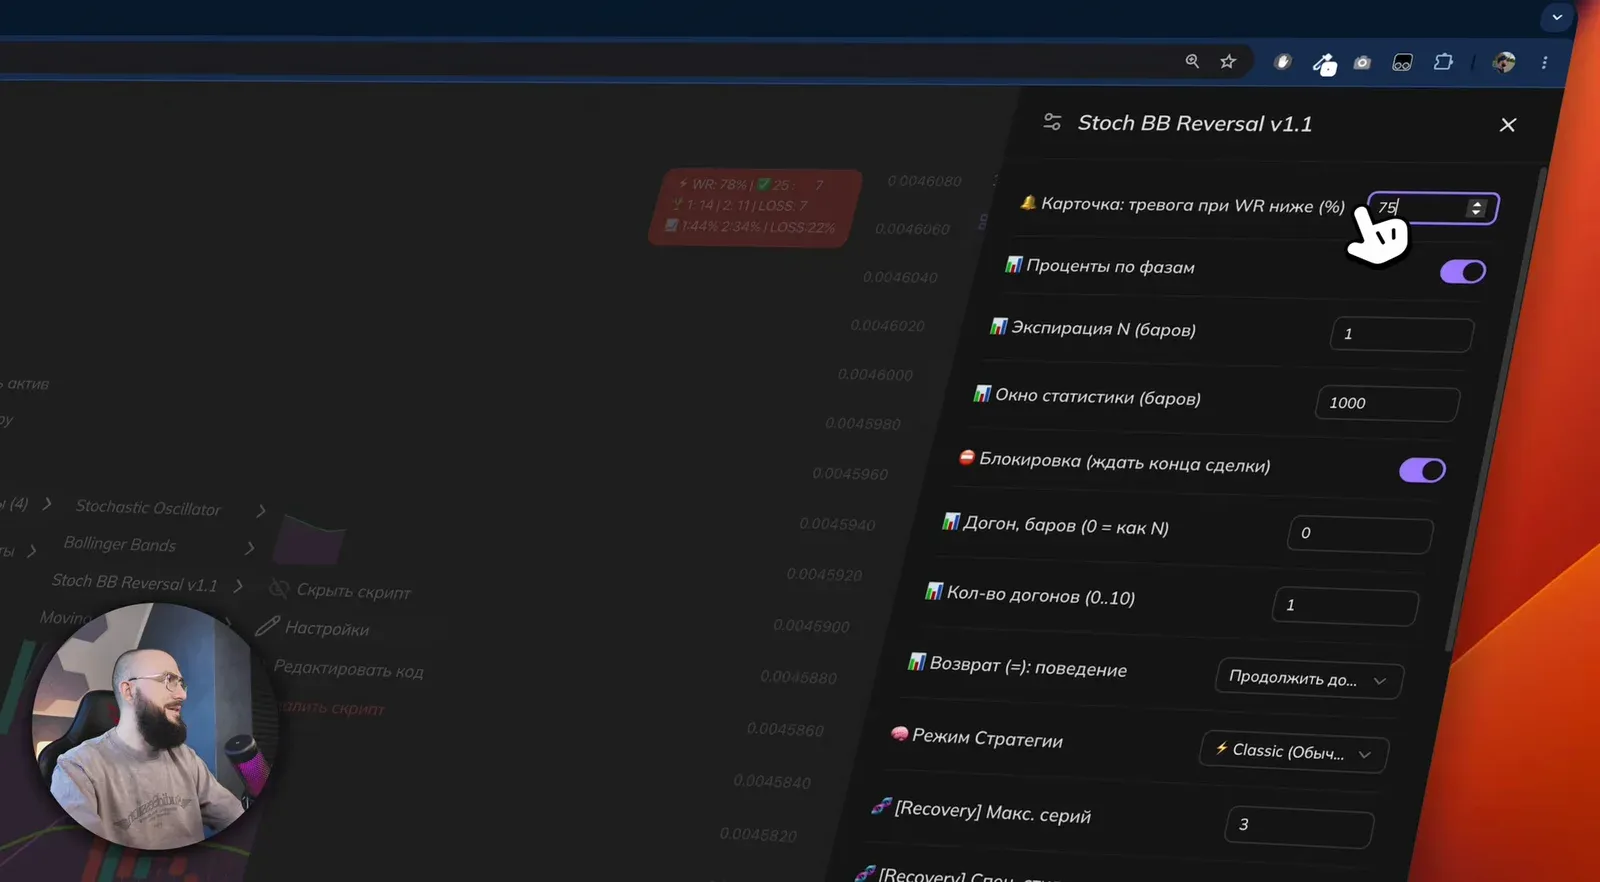
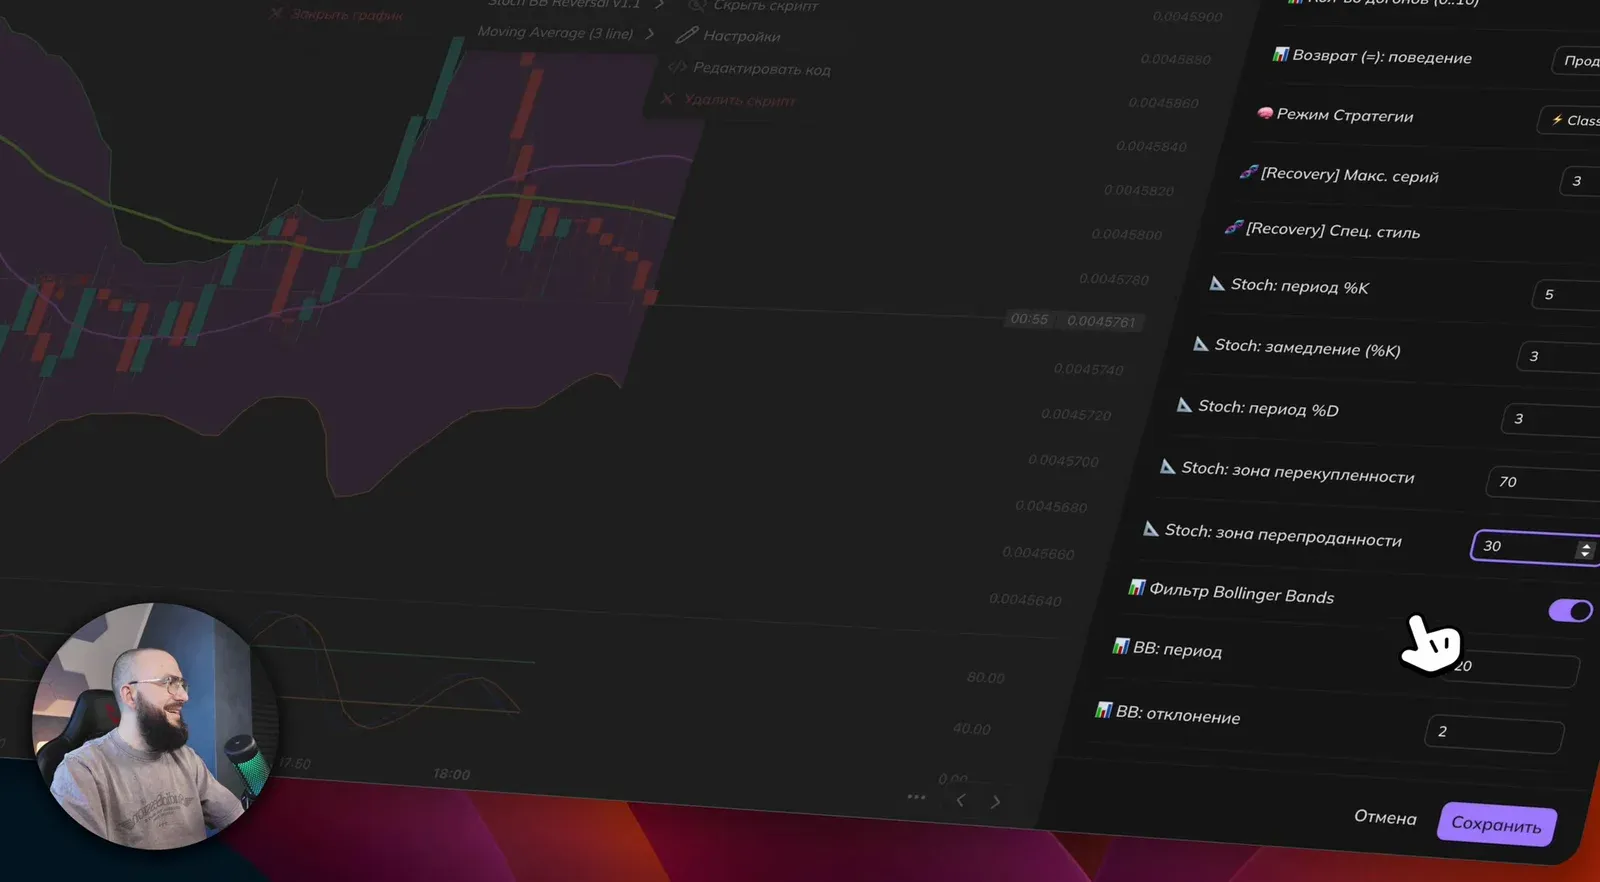
An important caveat from the video: a bot signal is a hint, not an order. The author only takes signals with a win rate of 75% or higher on the card and stresses that once the bot is installed there is no need to jump between charts: all screens are switched at once with mass actions, then you wait for the sound alert and verify the setup by eye.
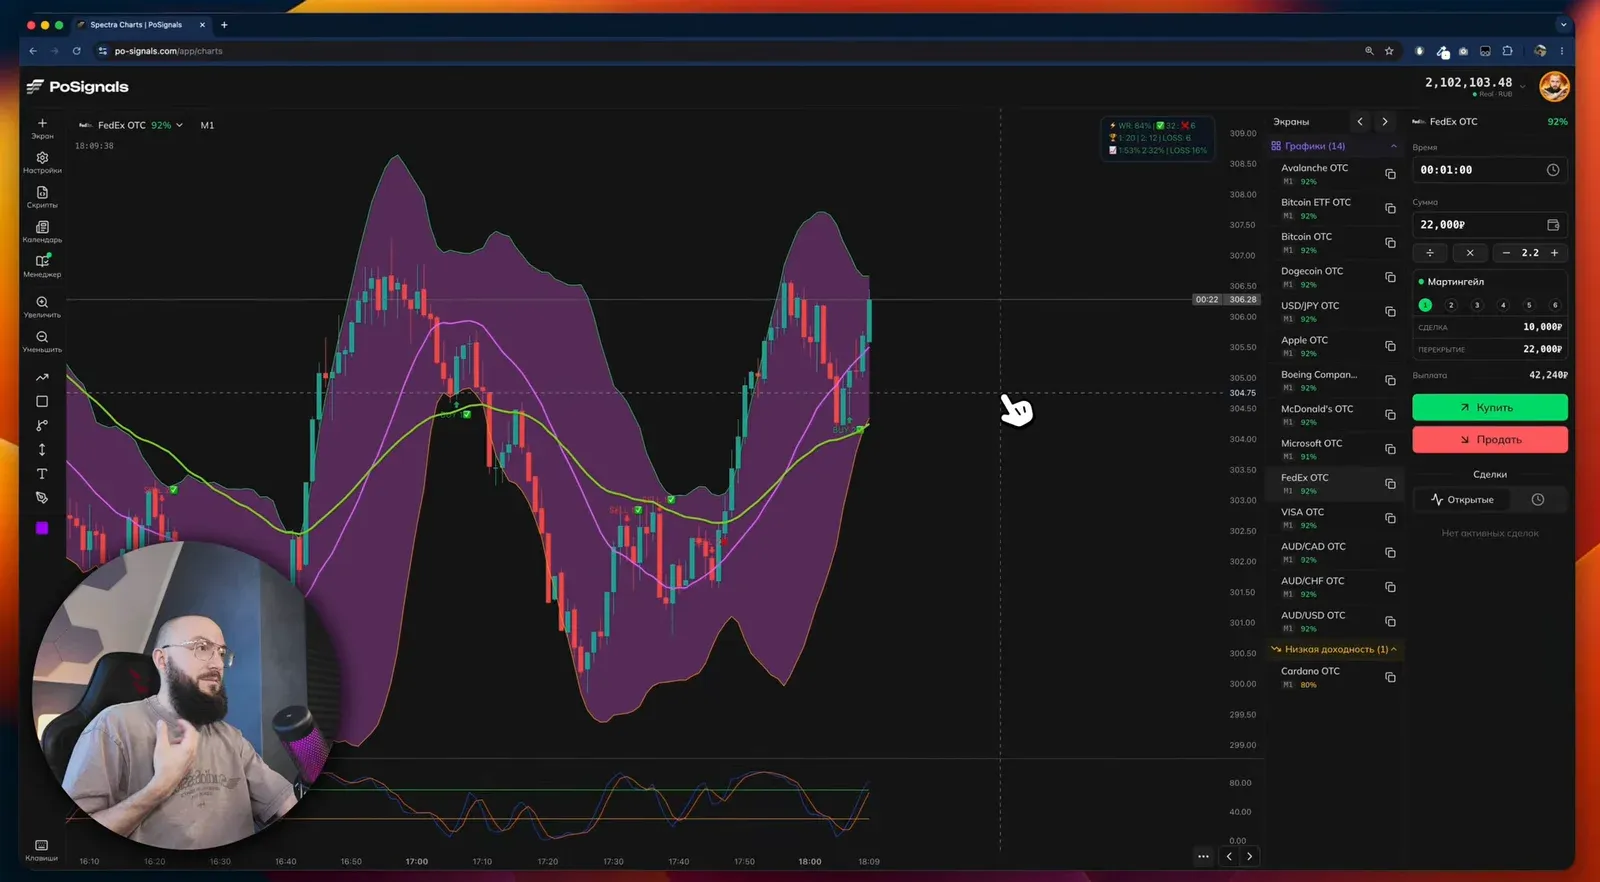
Money management in the video
Before trading, the author starts the trade manager and picks martingale with these parameters:
- first trade ₽10,000, which is 0.5% of the deposit;
- multiplier 2.2, six steps (the first trade plus five recovery trades);
- payout 92% for the calculation, session target 5%;
- optionally a session timer, for example 15 minutes: if no setups appear within that time, the session closes by itself.
The key limit: no more than one recovery trade per asset. After a loss and one recovery trade the author moves to another chart and starts there from the first amount. The manager fills in the next step size and logs the trades to the trader's journal.
The session from the video, trade by trade
The session was recorded on a weekend on OTC assets with a 92% payout. It went like this:
- The first buy after a pullback to the middle band closed as a loss. The author immediately takes one recovery trade on the same asset: price is at the lower band, the Stochastic cross is still valid. The recovery trade closes as a win.
- A bot buy signal on another asset: a cross at the 30 mark, the candle between the middle and lower band. Win.
- Another signal with a 70% win rate the author calls borderline: below 75% is best left alone.
- A buy against a weakening EMA goes to a loss and the recovery trade is taken late. The author admits the timing mistake but sticks to the one-recovery rule.
The result of the recording: wins and losses alternated roughly evenly, a hit rate around 50%. Thanks to the recovery trades the session stood at +₽30,000 at the time of recording. The author says it plainly: what carries the strategy is the discipline of the recovery trades rather than entry precision, and that is also its main risk.
Before you test it
- Demo first. The author repeats this in every video: check the settings on your own timeframe and your own assets.
- There are no 100% strategies. This is said twice in the video: losses are a normal part of the statistics.
- Weekend OTC means synthetic quotes. Price behaviour on exchange assets during the week can differ, see the OTC article.
- Sound instead of chart hopping. Switching all screens to the same indicator set and waiting for the bot alert cuts down on impulsive entries.
FAQ
Can I trade this strategy without the Stoch BB Reversal bot?
Yes. The bot only highlights moments when all three conditions line up and keeps a statistics card. The conditions themselves are checked by eye: the direction of EMA 50, a pullback to the middle Bollinger Band, and a Stochastic cross above 70 or below 30.
Why don't Stochastic crosses between 30 and 70 count as signals?
A cross in the middle of the range means the pullback has not reached an extreme zone yet. The strategy waits for the corrective impulse to fade, and that only shows beyond the 70 and 30 levels.
Does the strategy work on the 5-minute chart?
In the video it is shown on the 1-minute chart with a 1-minute expiration. The author invites viewers to test other timeframes themselves; the indicator settings would have to be re-checked on a demo account.