ZigZag + CCI 30-Second Strategy for Pocket Option: Trend Entries After a Pullback
A binary options strategy on the 30-second timeframe with a 1-minute expiration: ZigZag + Channels sets the trend, CCI with period 10 marks the end of the pullback. Entry rules, settings, risk and a breakdown of four trades from the video.
Contents
The strategy in this video was suggested to Nick by platform partners; he tested it on a real account and recorded a walkthrough. There are only two indicators, both standard: ZigZag + Channels shows the trend direction and sloped boundaries, and CCI catches the moment a counter-trend pullback runs out of steam. Below are the settings, the rules and the four trades from the video with an explanation of each.
The idea in short
Trade only in the direction of the trend, enter after a pullback. The trend is read from ZigZag: line going up means buy, line going down means sell. The pullback is tracked by CCI: when price pulls back against an uptrend and the indicator drops into the oversold zone, the buy signal is CCI leaving that zone upward. Selling is the mirror image: CCI leaving the overbought zone downward while ZigZag points down.
- Timeframe 30 seconds, expiration 1 minute: the trade lasts two candles.
- Assets are OTC currency pairs with a 92% payout; the payout threshold is set in the terminal with an alert if it drops below.
- Two indicators, no bots.
Indicators and settings
| Indicator | Settings from the video | What it does |
|---|---|---|
| ZigZag + Channels | window length 20, unchanged | trend direction and sloped channel boundaries |
| CCI (Commodity Channel Index) | period 10 instead of the default | a sensitive read of overbought and oversold |
| Support & Resistance Signals | optional, default settings | automatic horizontal levels as an extra reference |
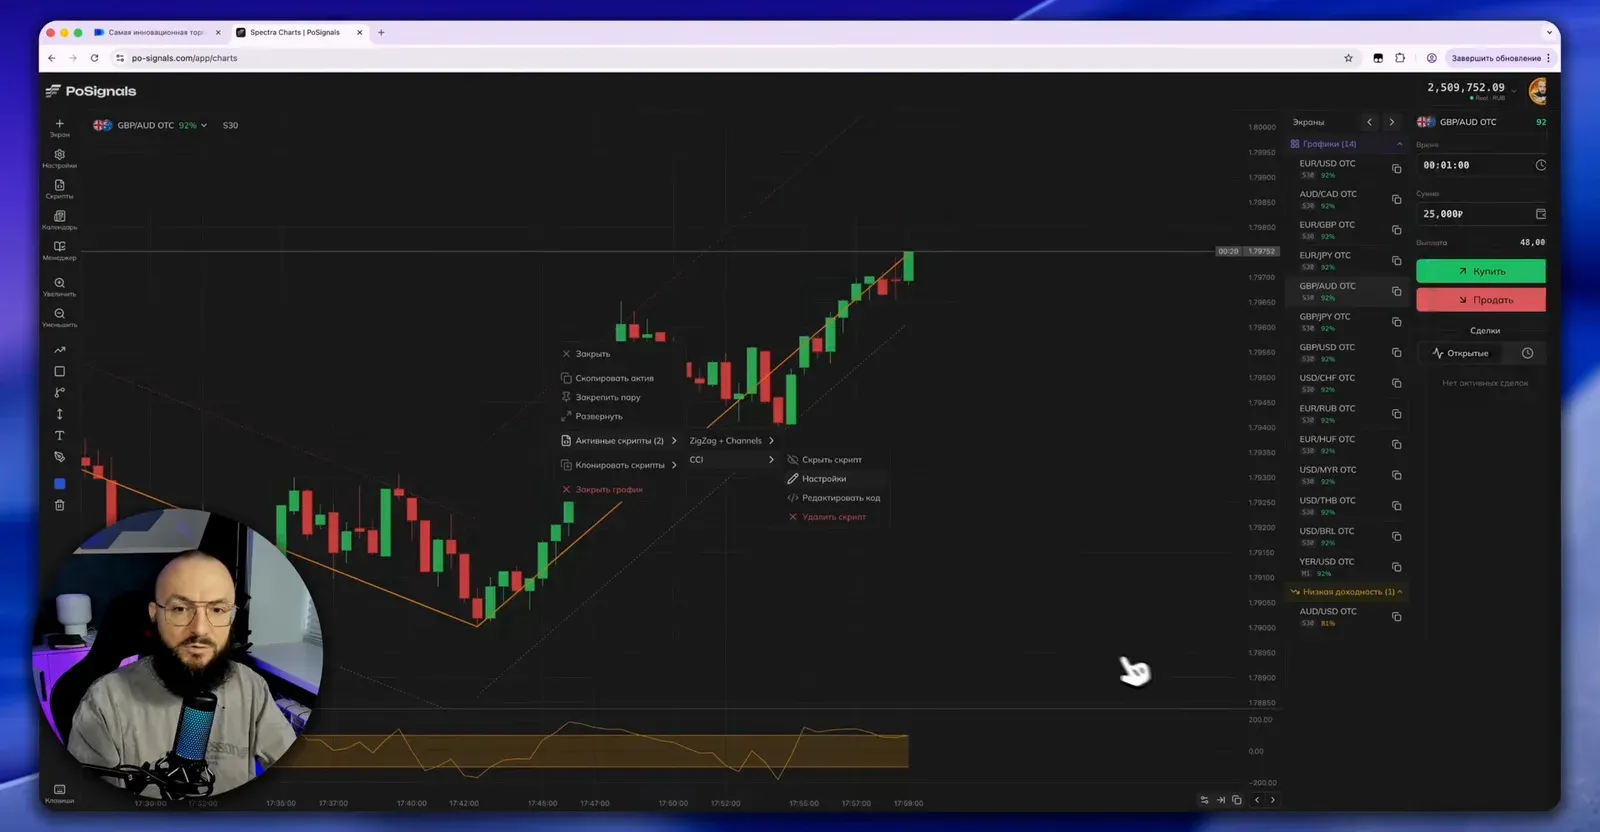
Both indicators come from the script catalog: search by name, click "Add to favorites", then place them on the chart from Favorites. The CCI period is changed via right click on the chart → Active scripts → CCI → Settings.
BinoView Supercharts — free for partners
Entry rules
| Buy | Sell | |
|---|---|---|
| Trend | ZigZag points up | ZigZag points down |
| Pullback | a dip against the trend | a rise against the trend |
| Signal | CCI visited the oversold zone and is leaving it upward | CCI visited the overbought zone and is leaving it downward |
| Price location | not at the upper sloped boundary | not at the lower sloped boundary |
| Entry | with a new candle, 1-minute expiration | with a new candle, 1-minute expiration |
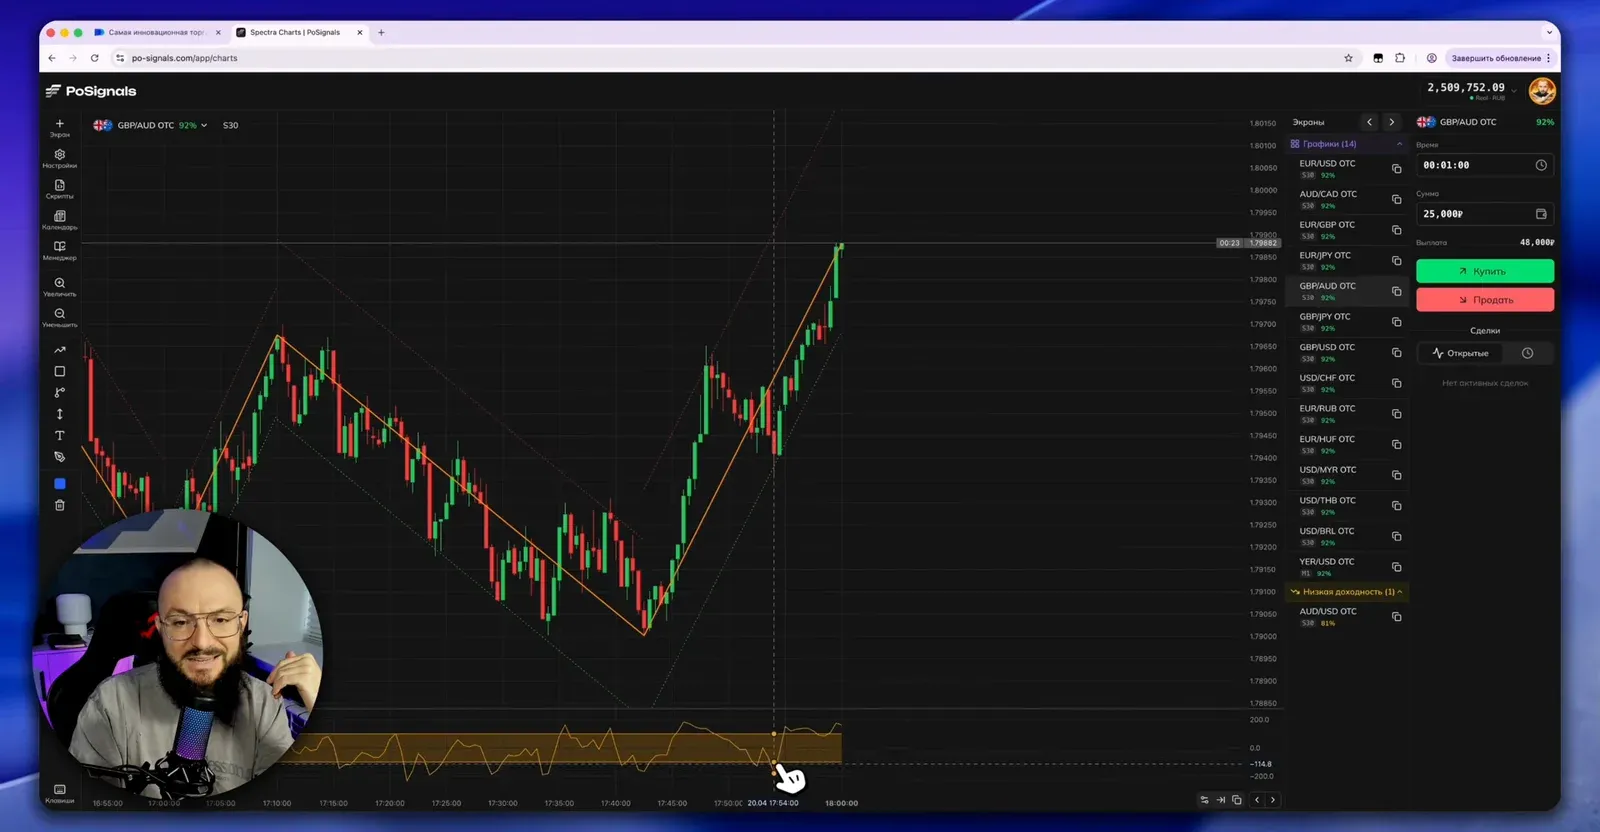
A key detail the author stresses after the second trade: wait for the CCI line to clearly cross the zone boundary and start turning, rather than entering early while it is still inside the extreme zone.
Money management in the video
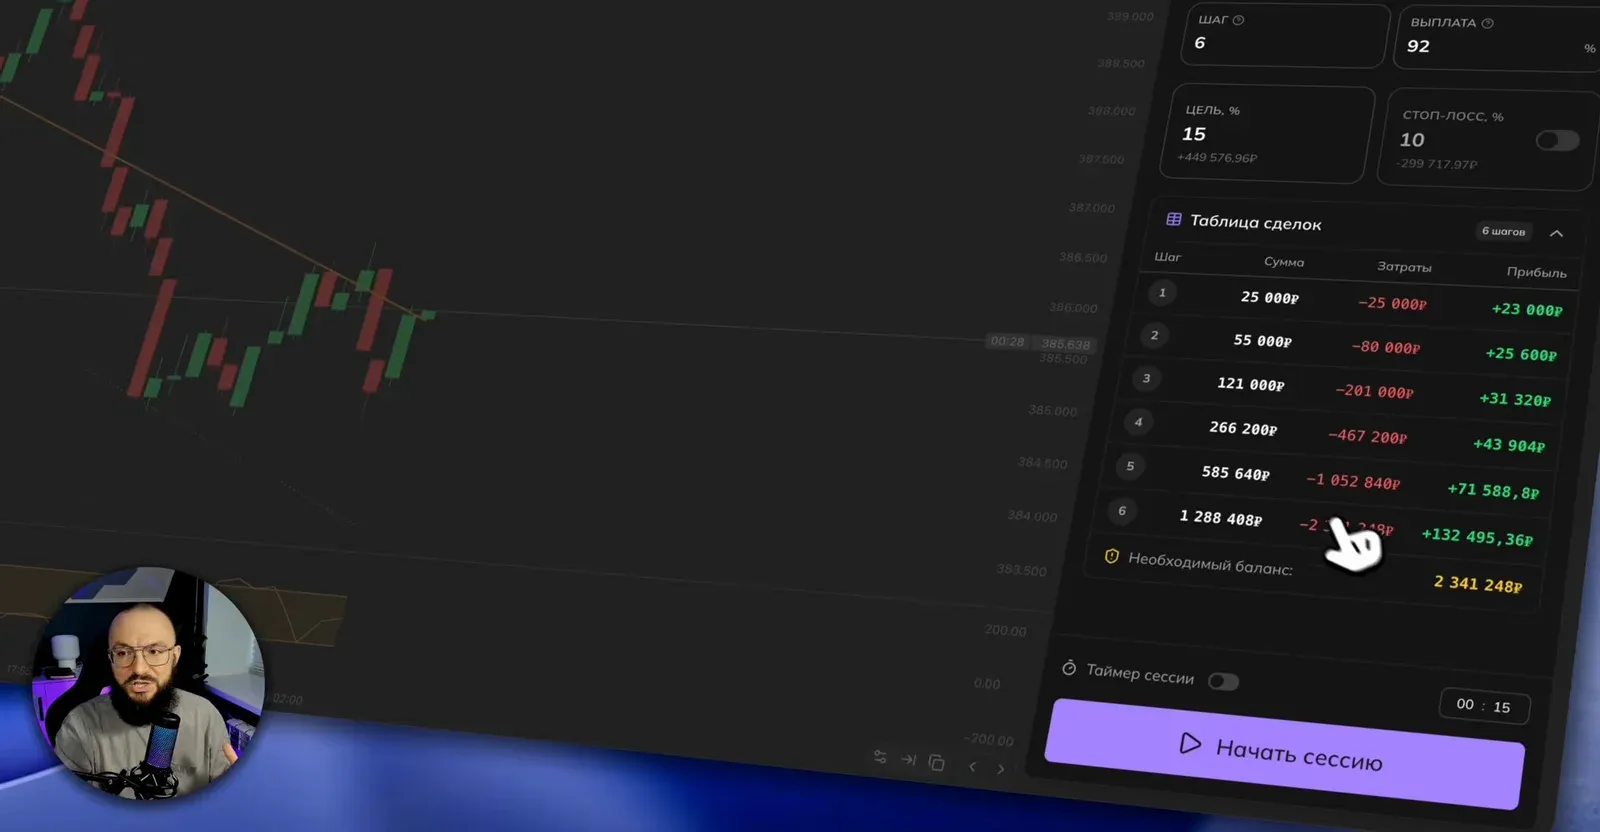
- First trade ₽25,000, which is 1% of the deposit. The author separately advises lowering the risk so that a series never reaches the sixth recovery step.
- After a loss, a doubled recovery trade by martingale through the trade manager, which calculates the next step and the required bank.
- Every trade goes into the trader's journal: direction, result, amount.
The four trades from the video
- A sell in a downtrend. ZigZag points down, CCI visited the overbought zone after an upward pullback and turned down. Win.
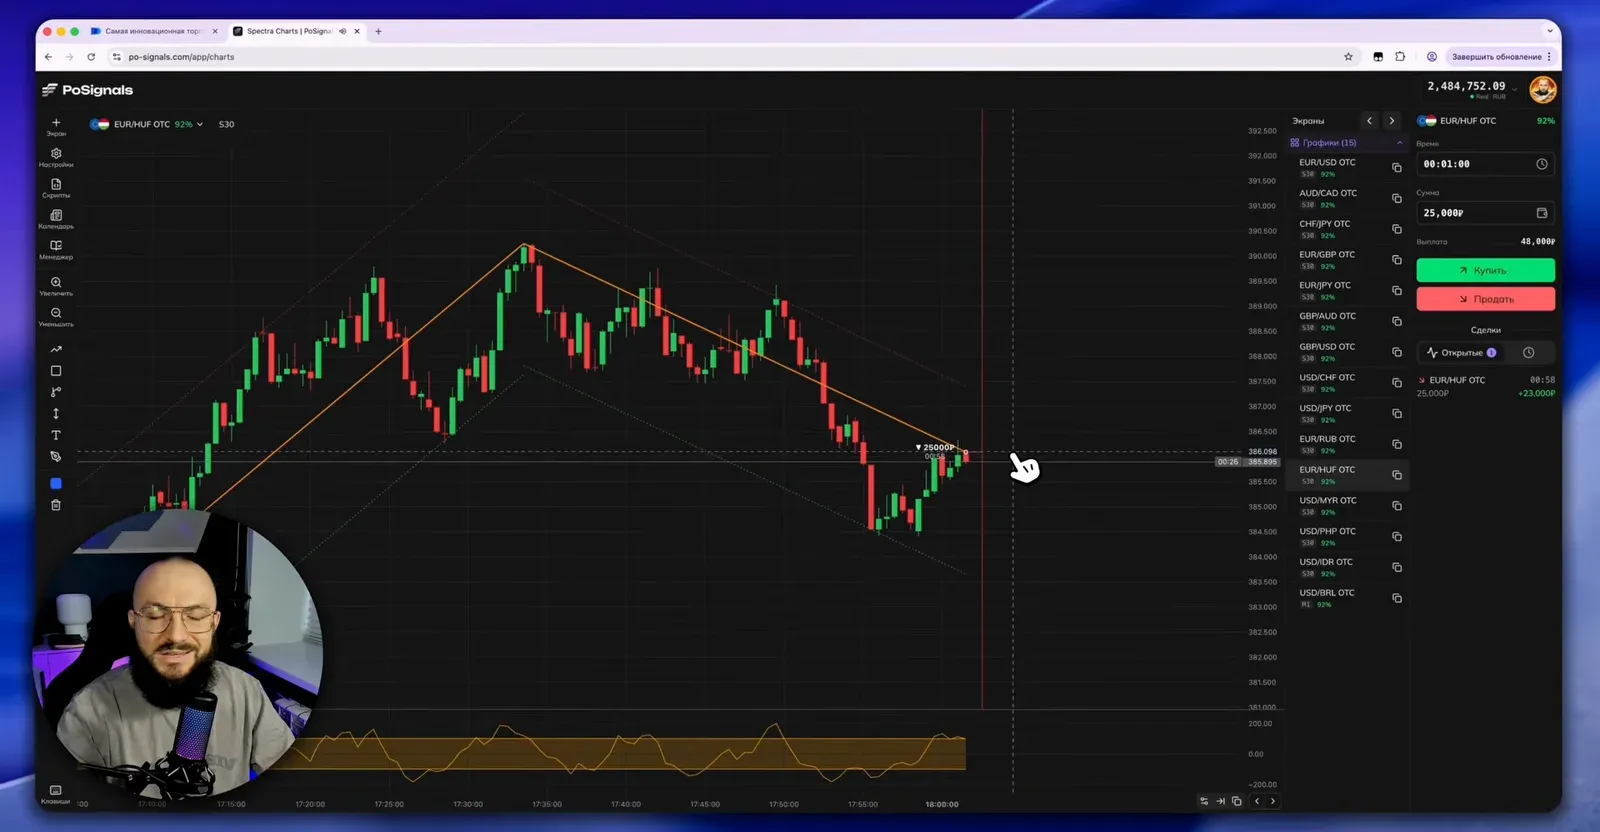
- An early buy. Uptrend, a pullback to a support level, CCI only approaching the lower boundary. The author enters before the line turns and takes a loss. His comment: a timing error, not a strategy error.
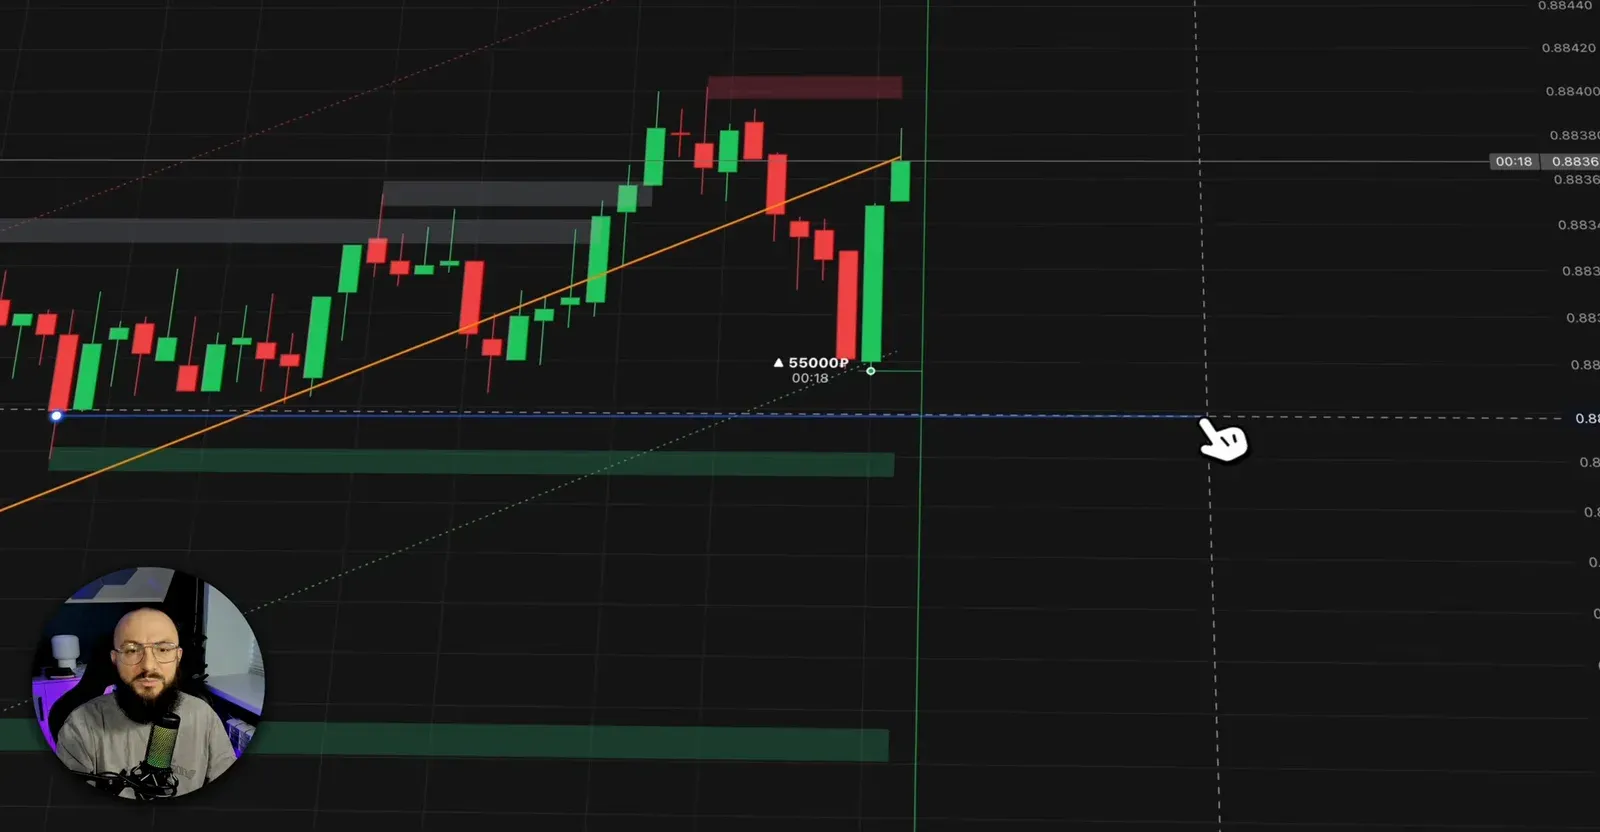
- A ₽55,000 recovery trade. Same asset, CCI already in the oversold zone and turning, with a support level drawn through a cluster of wicks nearby. Win, the series is recovered.
- A sell from resistance. A broader downward move with lower highs, ZigZag down, CCI left the overbought zone on the previous candle. Win.
The journal result of the recording: four trades, three wins and one loss, +₽71,600 for the session. The loss was covered on the next step, and that is what put the session in profit rather than any "perfect" entries.
Before you test it
- A level is a zone, not a line. In the second trade the author moves the support level above the automatic one because more wicks touch there. The indicator draws an average; the eye can be more precise.
- Do not enter at a sloped boundary against the trade. That is exactly what the ZigZag channel filter is for.
- Demo before real. The author repeats this three times in the video: rehearse the setups on a demo account first, then a real account with strict risk management.
- Payout. The terminal warns on assets below your payout threshold; low-payout trades break the math of recovery trades.
FAQ
Why a 30-second timeframe with a 1-minute expiration?
The trade lasts exactly two candles. The half-minute chart shows the pullback in more detail, while the 1-minute expiration gives price time to return to the trend after CCI leaves the extreme zone.
Why set CCI to period 10 instead of the default 20?
A shorter period makes the indicator more sensitive: it reacts faster to small pullbacks and to exits from the overbought and oversold zones, which last only a few candles on a 30-second chart.
Can I enter when price sits at the sloped channel boundary?
Not if the boundary is against the trade direction. That is one of the reasons ZigZag + Channels is on the chart: do not buy at the upper boundary and do not sell at the lower one, because price tends to bounce from there.