Manual Support and Resistance Strategy for Binary Options
Manual binary options trading from levels and trendlines: the Average Support Resistance and Adaptive Trend Finder indicators, what the level colors mean, trend checks on M15 and M5, trade manager setup and the trader's journal. A session breakdown from the video.
Contents
There are no signal bots in this video. Nick shows the manual support-and-resistance trading he uses himself and, along the way, explains how the trade manager works and why a trader's journal matters. According to the manager's statistics at the time of recording, manual trading by these rules produced +$2,000 over 7 days and +$5,843 over 30 days. Below are the rules, the settings and a breakdown of the session.
Preparing the terminal
- On a weekend the OTC assets are opened; the author keeps only currency pairs and applies the selection to every screen with a mass action.
- The chart is zoomed out to see levels and zones rather than the last ten candles.
- The trade manager is started: without an active session trades do not reach the journal and no strategy statistics accumulate.
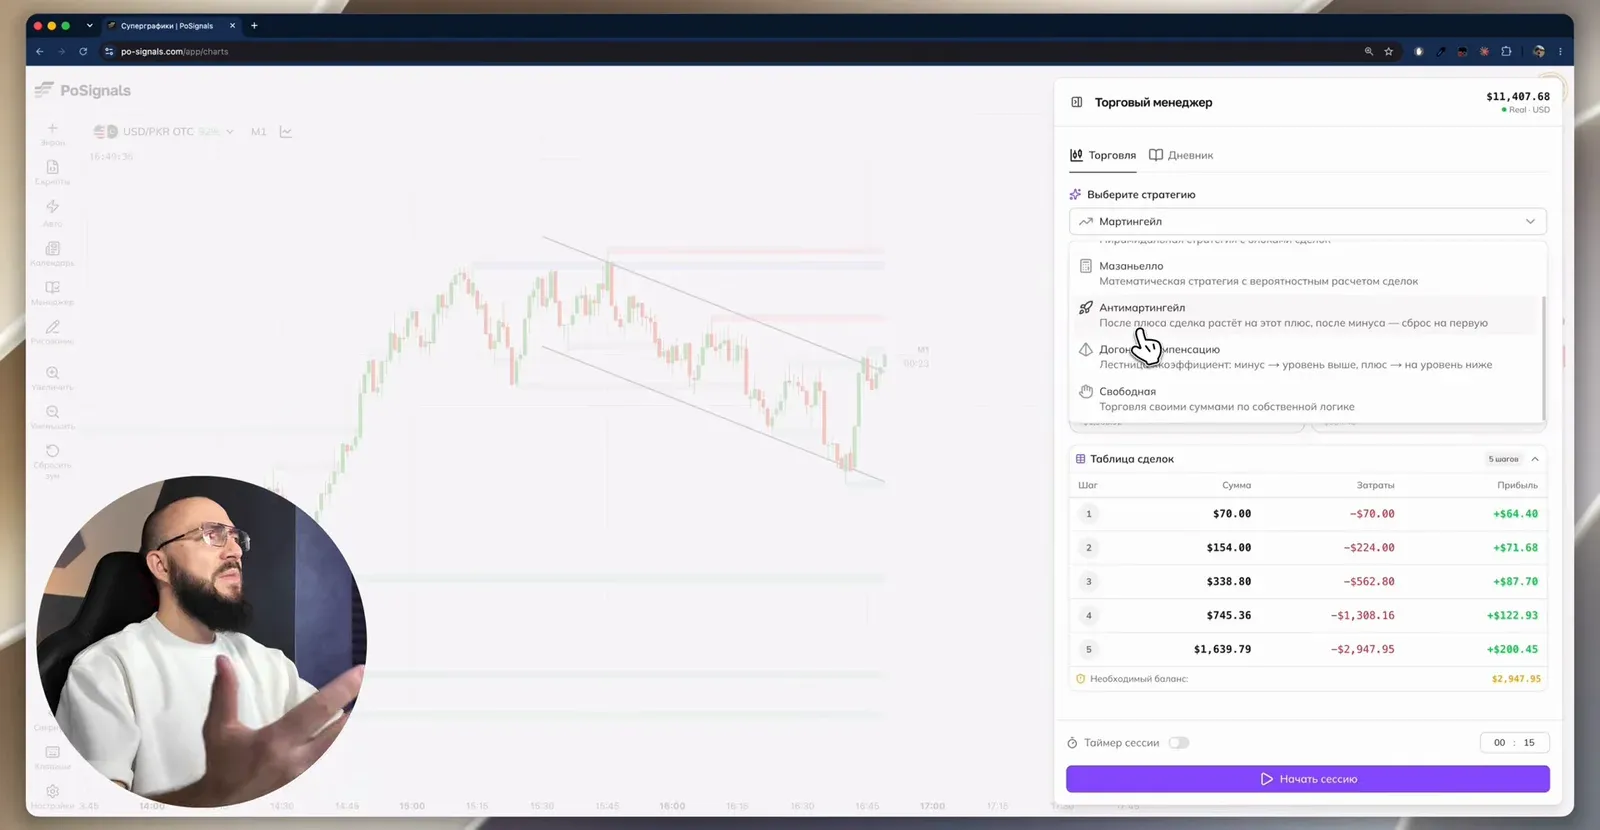
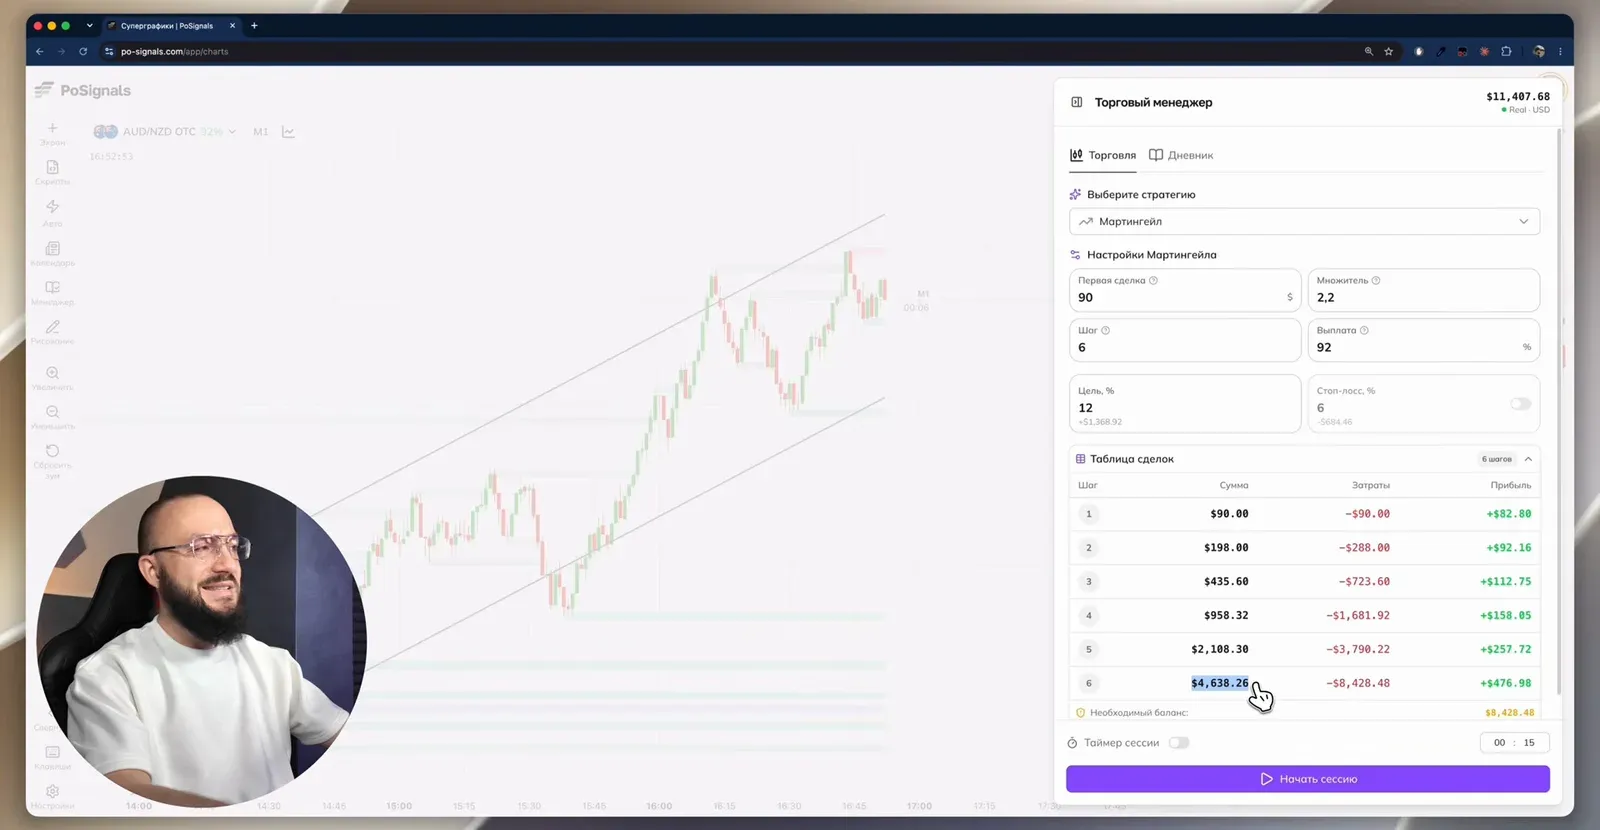
Session settings from the video:
| Parameter | Value | Author's comment |
|---|---|---|
| Strategy | martingale | high risk, but fast progress once a strategy is proven |
| First trade | $90 | beginners: $1, the minimum for a dollar account |
| Multiplier | 2.2 | the sixth step of $4,638 fits under the $5,000 per-trade limit |
| Steps | 6 | the first trade plus five recovery trades |
| Payout | 92% | only used to compute the table |
| Target | 12% | the author rarely reaches it and usually stops earlier |
| Session timer | optional, 15–30 minutes | a forced stop so you do not overstay |
BinoView Supercharts — free for partners
Two indicators
| Indicator | What it shows |
|---|---|
| Average Support Resistance | averaged support and resistance zones: the indicator merges several nearby extremes into one zone |
| Adaptive Trend Finder | the local trend as sloped lines |
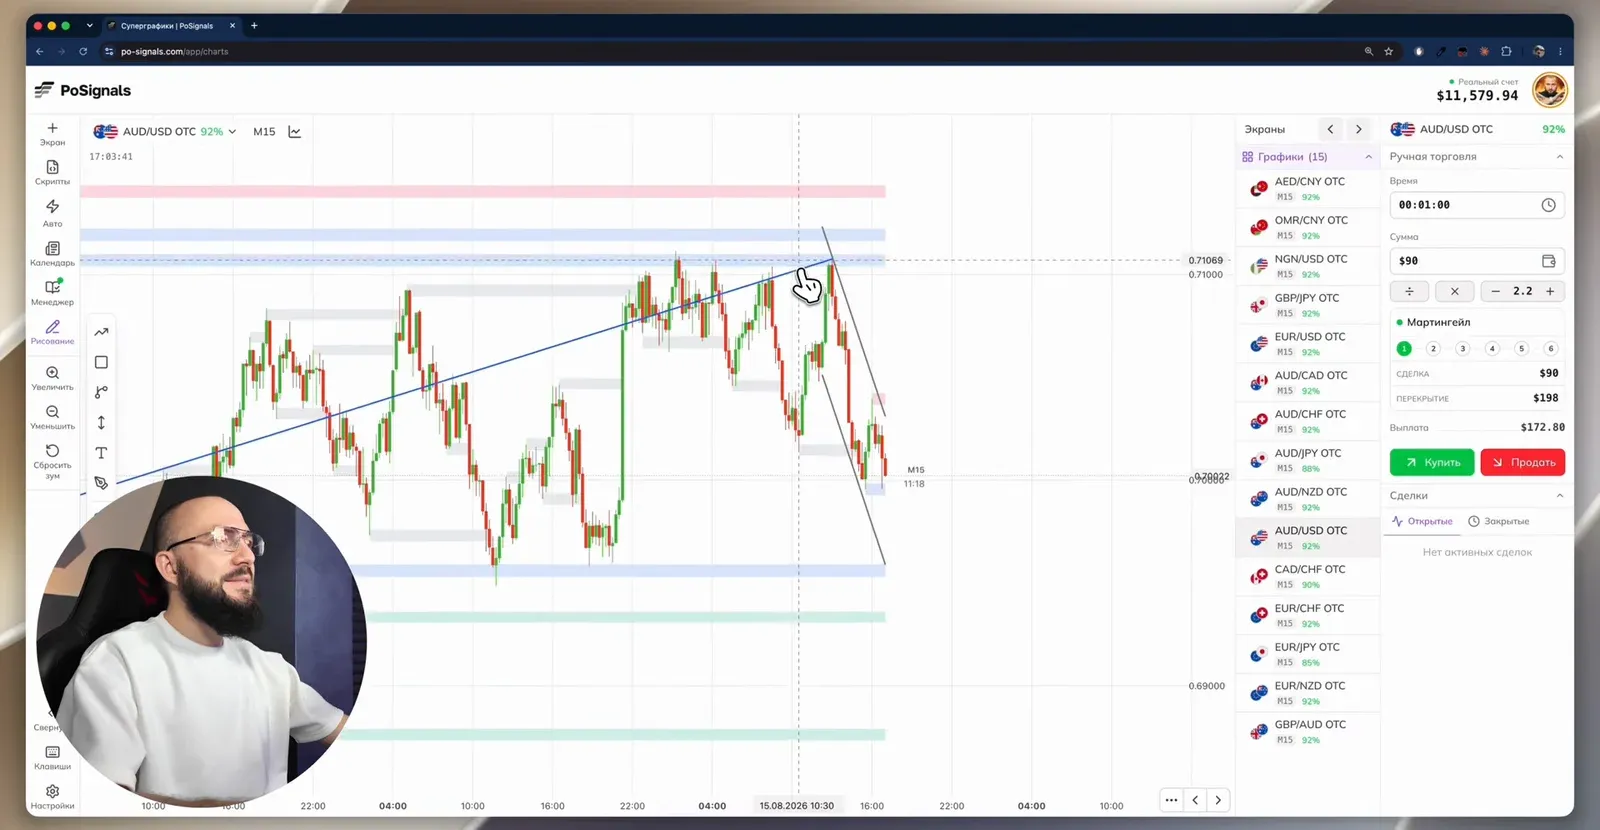
Zone colors in Average Support Resistance:
- red — resistance, where price may bounce down;
- green — support, where price may bounce up;
- blue — a level that has already produced a bounce: the reaction is confirmed;
- grey — a past or mirrored level.
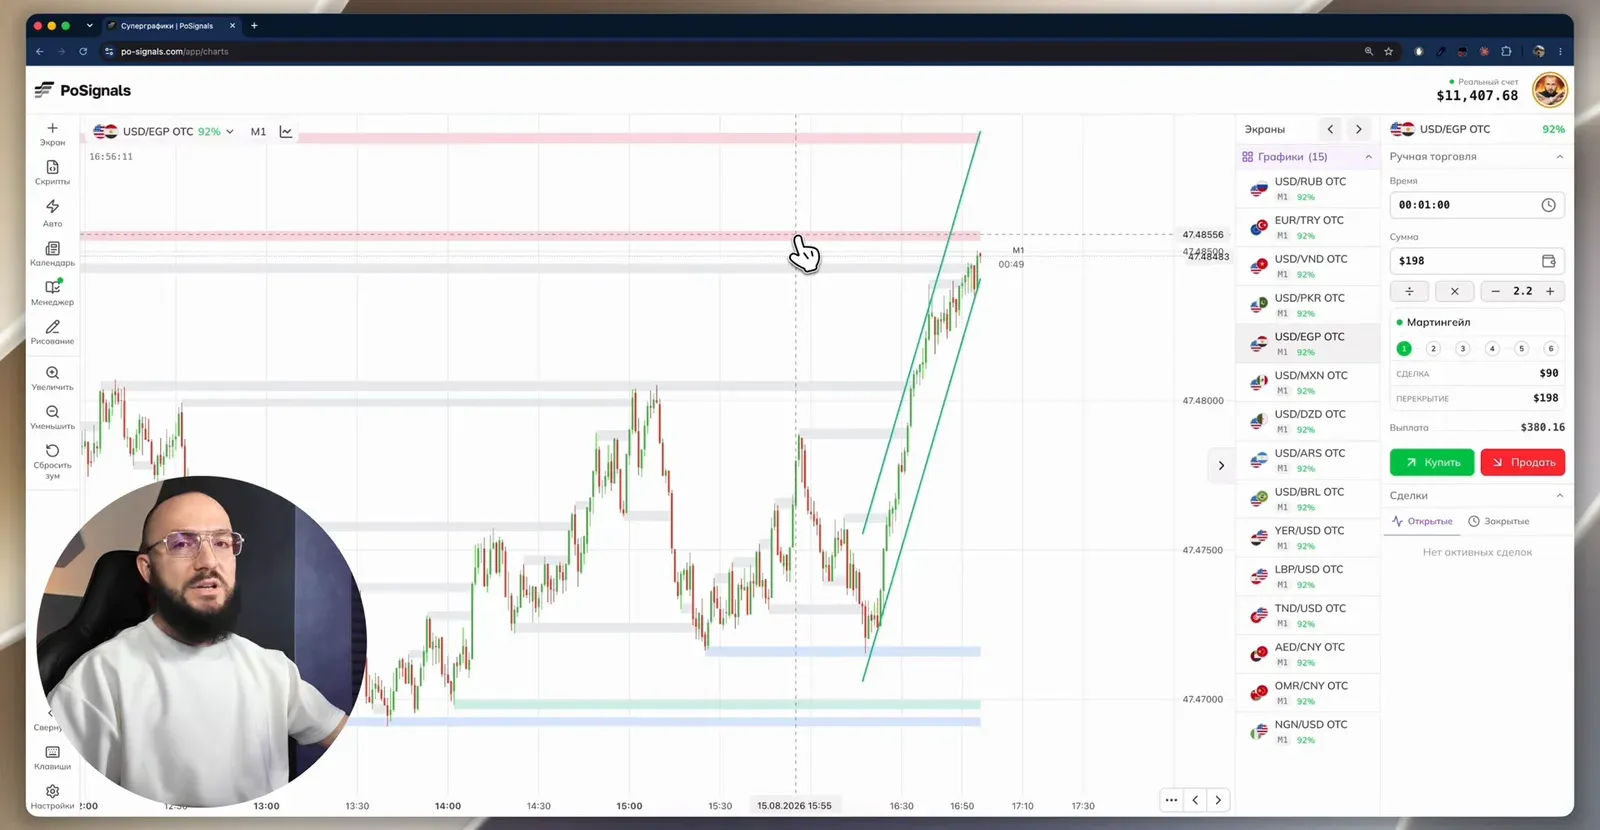
A level is a zone with a margin of error, not a line: the indicator averages several points and price does not have to reach it exactly.
Entry rules
- Enter on a bounce from a zone with a confirmed reaction. The more touches, the stronger the level: the author counts a level from three points.
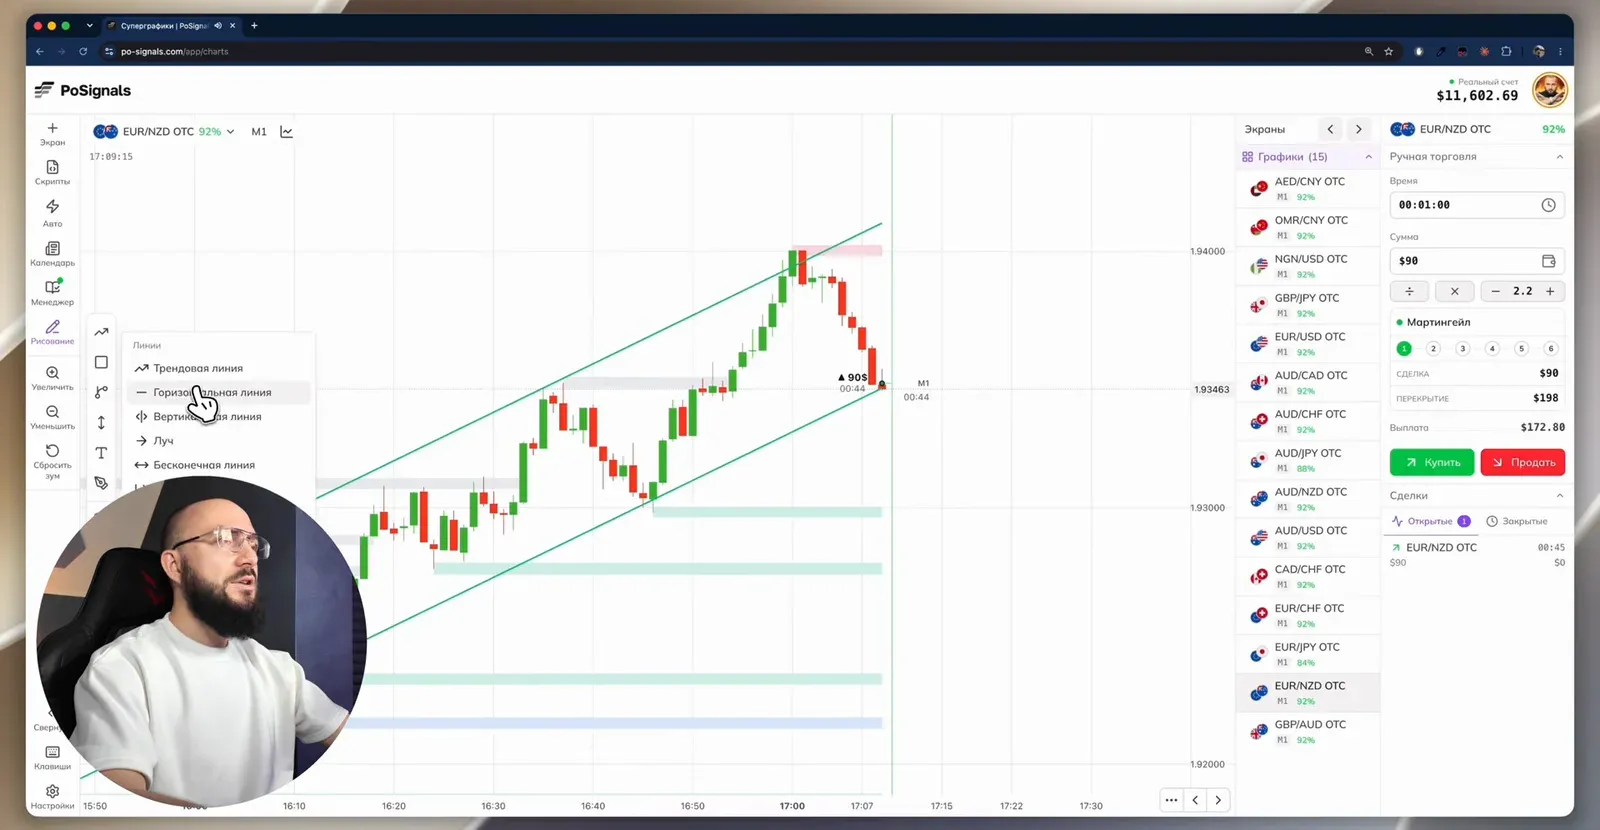
- Enter from a trendline. If a sloped line runs through three or four points, the current touch is a reason to open a trade in the bounce direction.
- Broken resistance becomes support. After a breakout, a trade opens from the same level in the breakout direction.
- The trend is checked on three timeframes. M15 first, then M5, entry on M1. The higher timeframes give the direction and the nearest levels; if price sits on a level on M5, the author does not enter on M1 and waits for a pullback.
- 1-minute expiration, entry with a new candle.
- Against the trend only in exceptional cases: when the level is blue and a trendline is nearby.
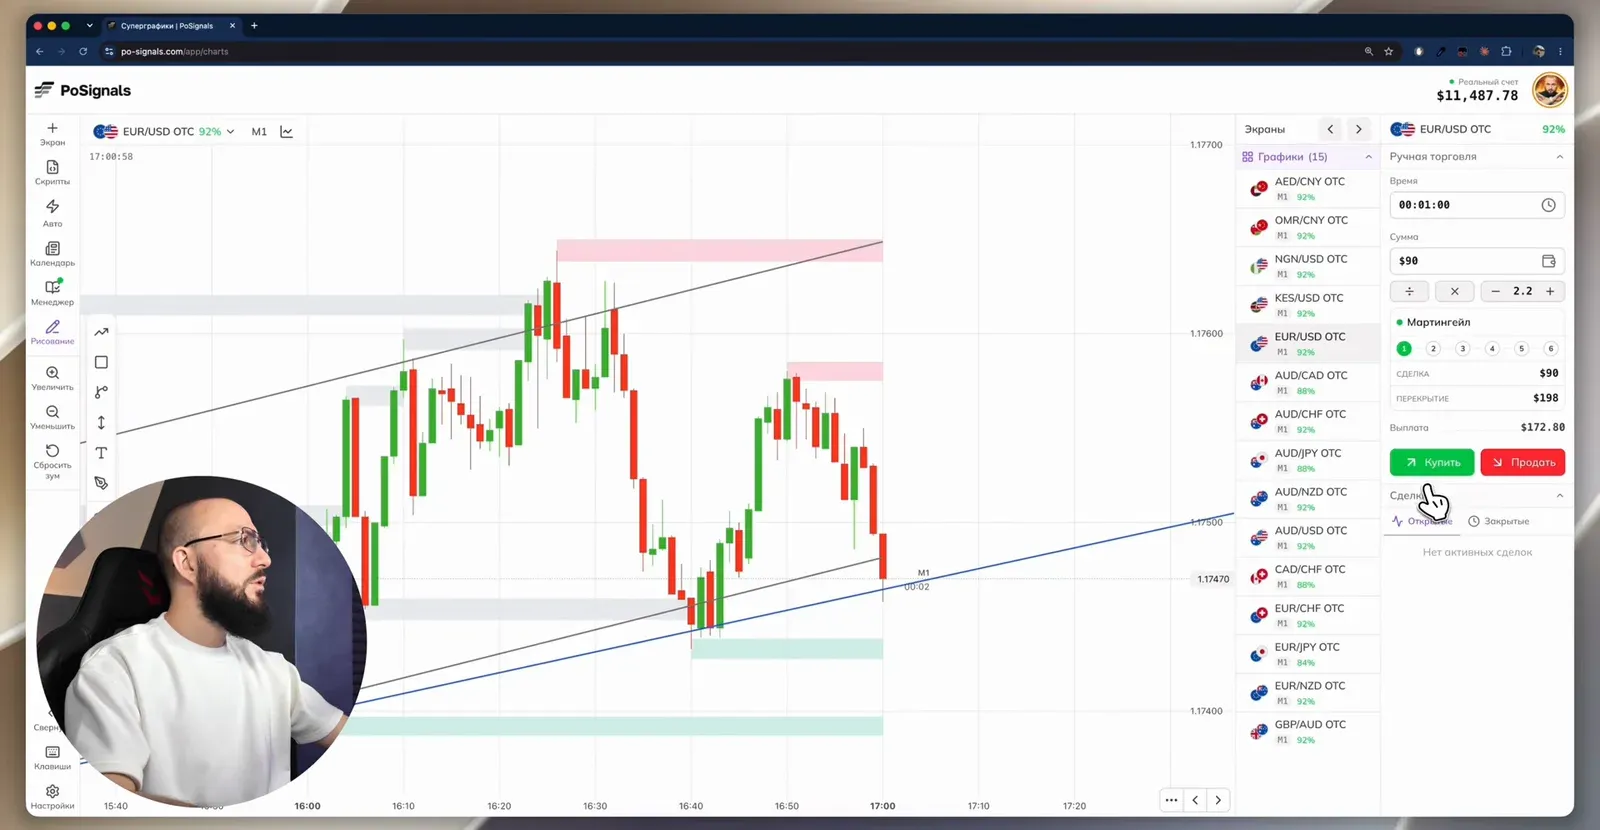
The session from the video
- A sell from a blue level against the local trend: two touches in the past and a third one now. The author prepares a recovery trade in advance. Win.
- A buy from a trendline with three touch points. One corrective candle is enough and the trade closes as a win.
- A series of three sells after checking M15 and M5: the first is a loss, the second recovery trade is a loss, the third from a small resistance along the trendline closes as a win in the final seconds. The author's comment: risky, lucky, but by the rules.
- A buy from former resistance turned support, with a fourth touch of the trendline. A win in the last second.
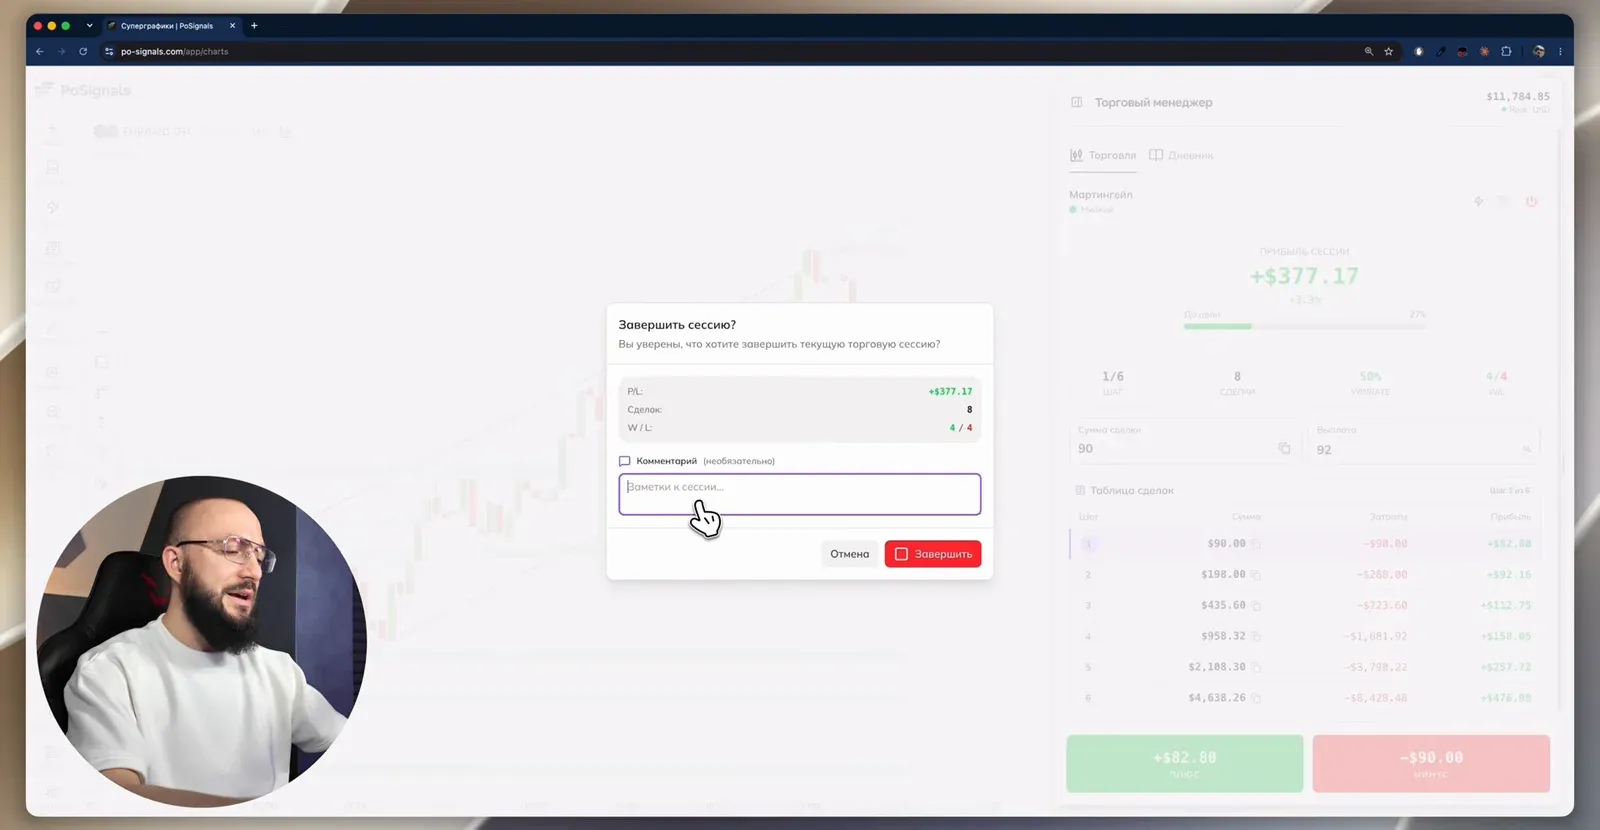
Session result in the manager: 8 trades, 4 wins and 4 losses, +$377. The author stops without waiting for the 12% target: a few wins are in, there is no reason to sit longer.
The trader's journal
When a session is closed, the manager asks for a comment: which strategy was traded, what went wrong. Each trade can later be edited with a note about the emotion or the reason for the entry. The point is to open the session a week later and understand why a loss happened instead of reconstructing it from memory. The author used to keep such notes in a notebook; now the manager keeps them automatically.
Before you test it
- Weekend OTC means synthetic quotes; price behaviour can differ from exchange assets during the week. See the OTC article.
- Levels have a margin of error. Do not wait for a pixel-perfect touch: the indicator averages, and price may fall short or overshoot.
- Prepare the recovery trade in advance. In the session from the video the series reached the third step, and the author himself calls it risky: a win in the last second is not something to count on.
- Rehearse on a demo account. Learn to read the zone colors and trendlines first, then move to a real account.
FAQ
What do the level colors in Average Support Resistance mean?
Red is resistance, green is support, blue is a level that has already produced a bounce, grey is a past or mirrored level. Blue levels are the most interesting for entries: the price reaction from them is already confirmed.
Why use the trade manager if trades can be opened by hand?
The manager shows the current step of the chosen progression, fills in the next trade amount and logs everything to the trader's journal. Without an active session nothing is recorded, and you cannot build statistics for the strategy later.
Can I enter against the trend from a level?
The author does that only in exceptional cases: when the level is blue, meaning it has already produced a reaction, and there is a trendline nearby. By default trades follow the trend direction confirmed on M15 and M5.