1-Minute Pocket Option Strategy: ZigZag, Vortex and Awesome Oscillator
A 1-minute binary options strategy on three standard indicators: ZigZag (5, 5, 3) sets the trend, Vortex (12) marks the start of a move, Awesome Oscillator (5, 30) confirms momentum. Entry rules, filters, deposit allocation and a session breakdown.
Contents
A tutorial on a 1-minute strategy built on three standard indicators: ZigZag shows the short-term trend, Vortex marks the start of a new move, and the Awesome Oscillator confirms momentum. The author trades directly on the standard Pocket Option platform, so the strategy is not tied to any terminal: the same indicators are available in BinoView Supercharts. Below are the settings, rules, deposit allocation and the trades from the video.
The idea in short
Enter only when all three indicators point the same way. Each answers its own question:
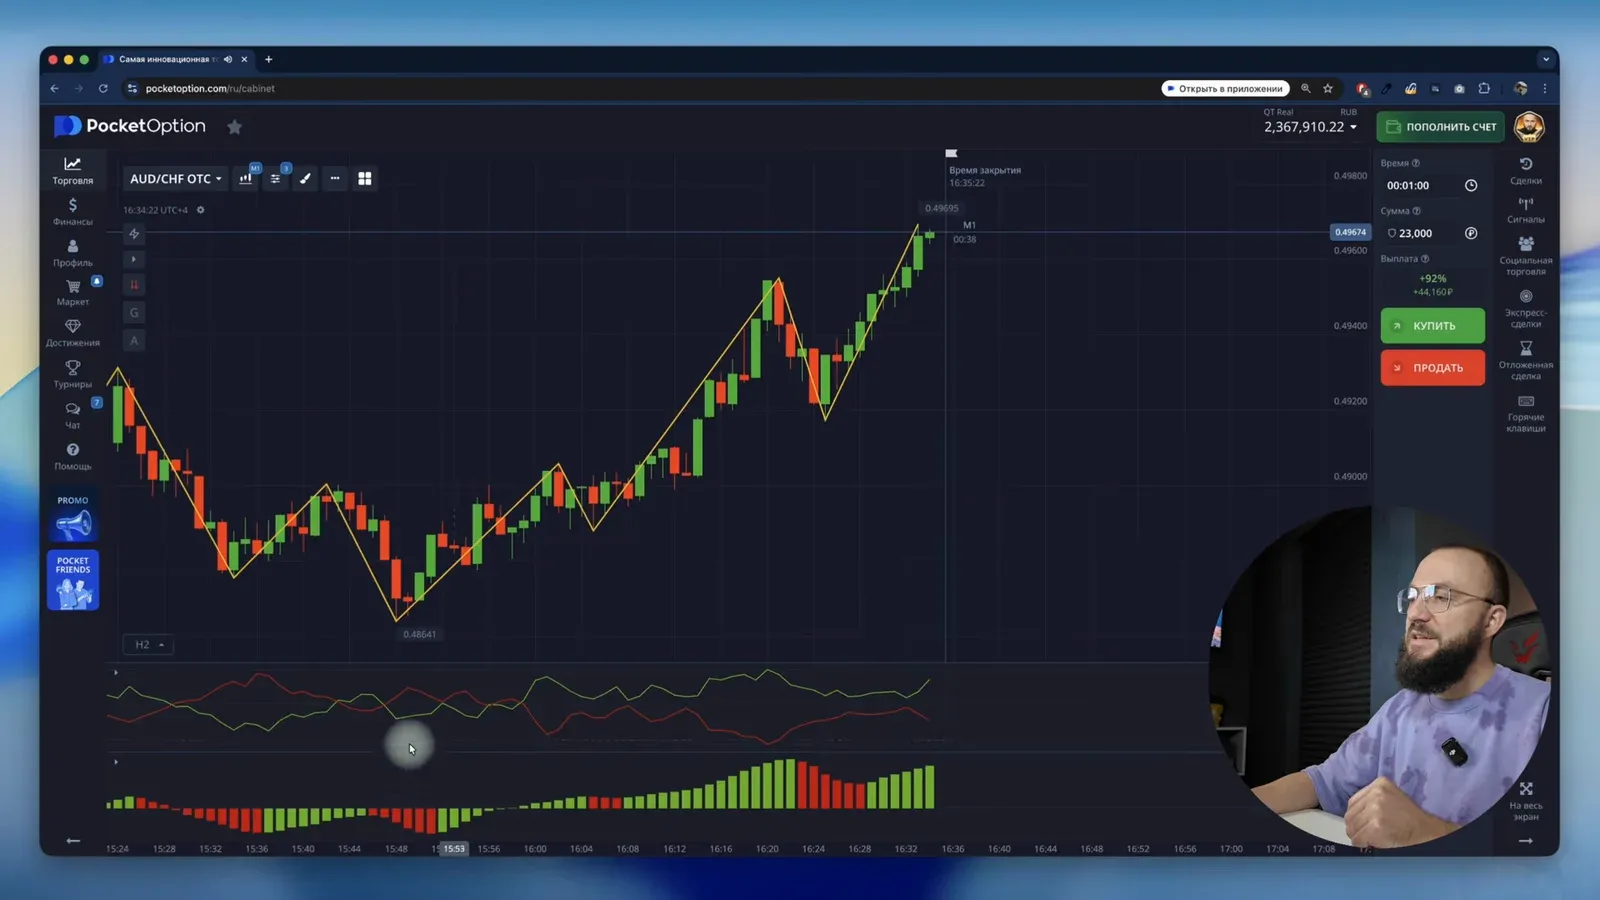
- ZigZag — the short-term trend on 1-minute candles: line up means an upward move, line down means a downward one.
- Vortex — the start of a new move. Red line on top means a downtrend, green on top means an uptrend. The lines narrowing toward each other hint at a possible reversal.
- Awesome Oscillator (AO) — current momentum. You need at least three bars of the same color: three red bars confirm a move down, three green bars confirm a move up.
Timeframe M1, expiration 1 minute.
Indicator settings
| Indicator | Settings from the video | Why these values |
|---|---|---|
| ZigZag | 5, 5, 3 | more sensitive than the defaults, reacts faster to a change of short-term trend |
| Vortex | period 12 | shorter than the default, marks the line cross sooner |
| Awesome Oscillator | 5 and 30 | fast and slow averages for the momentum histogram |
BinoView Supercharts — free for partners
Entry rules
| Buy | Sell | |
|---|---|---|
| ZigZag | points up | points down |
| Vortex | green line on top, or the lines widening upward | red line on top, or the lines narrowing before a change |
| Awesome Oscillator | at least three green bars | at least three red bars |
| Entry moment | with a new candle or on a red pullback candle | with a new candle or on a green pullback candle |
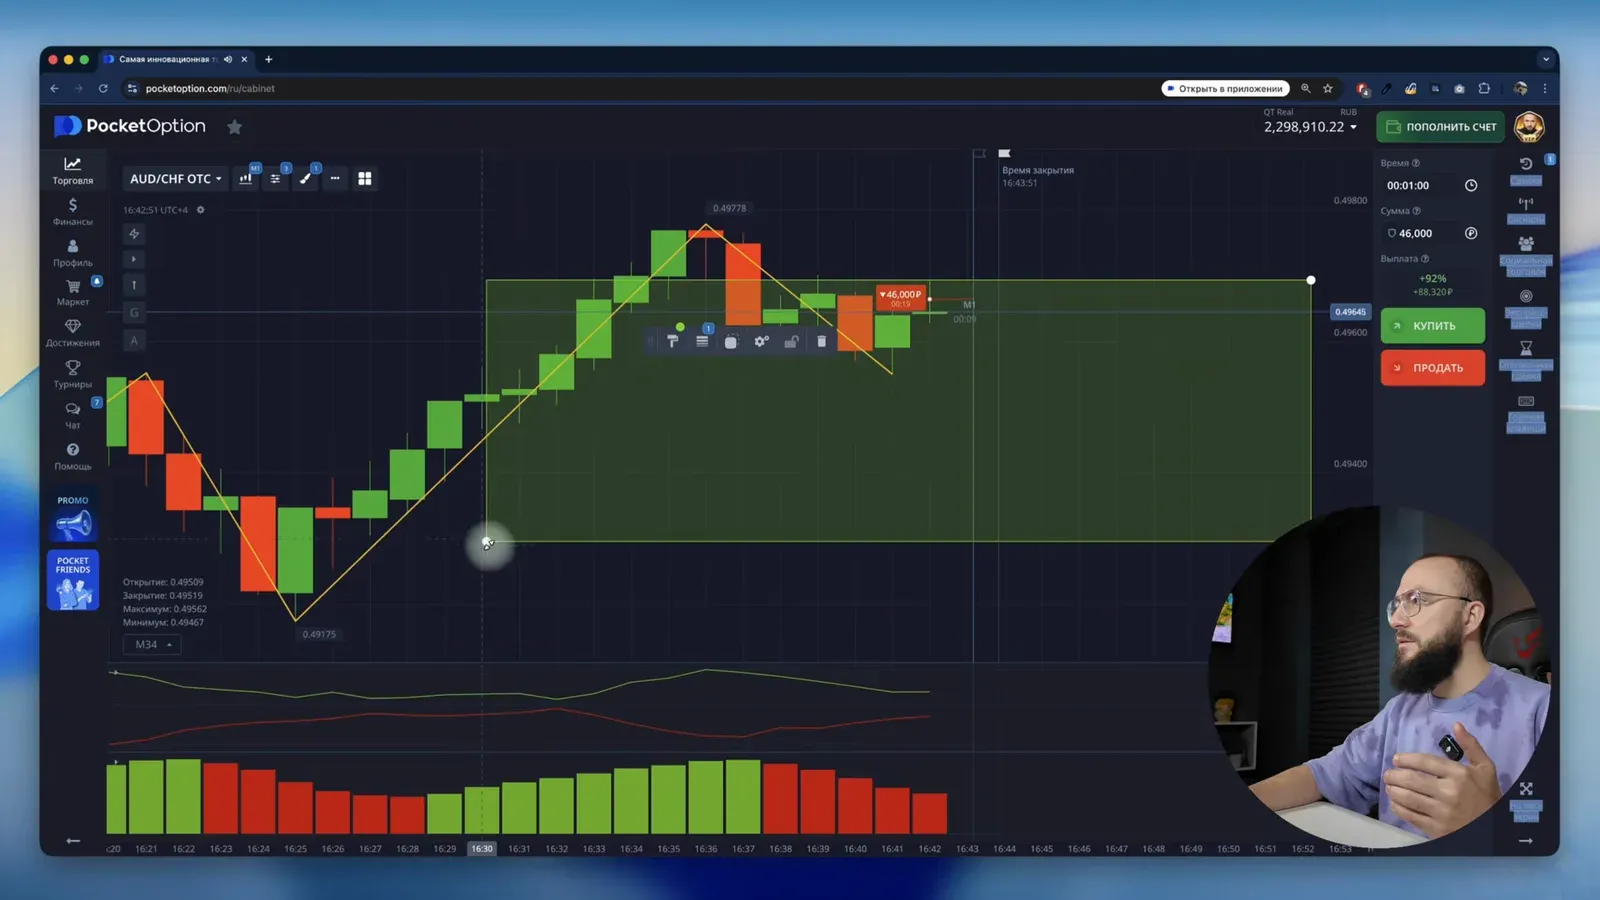
The author considers the pullback candle the best entry: after an impulse candle in the trend direction, one candle appears against it, and the next trade opens with the trend. That catches the continuation of the impulse rather than its tail.
Filters: when not to enter
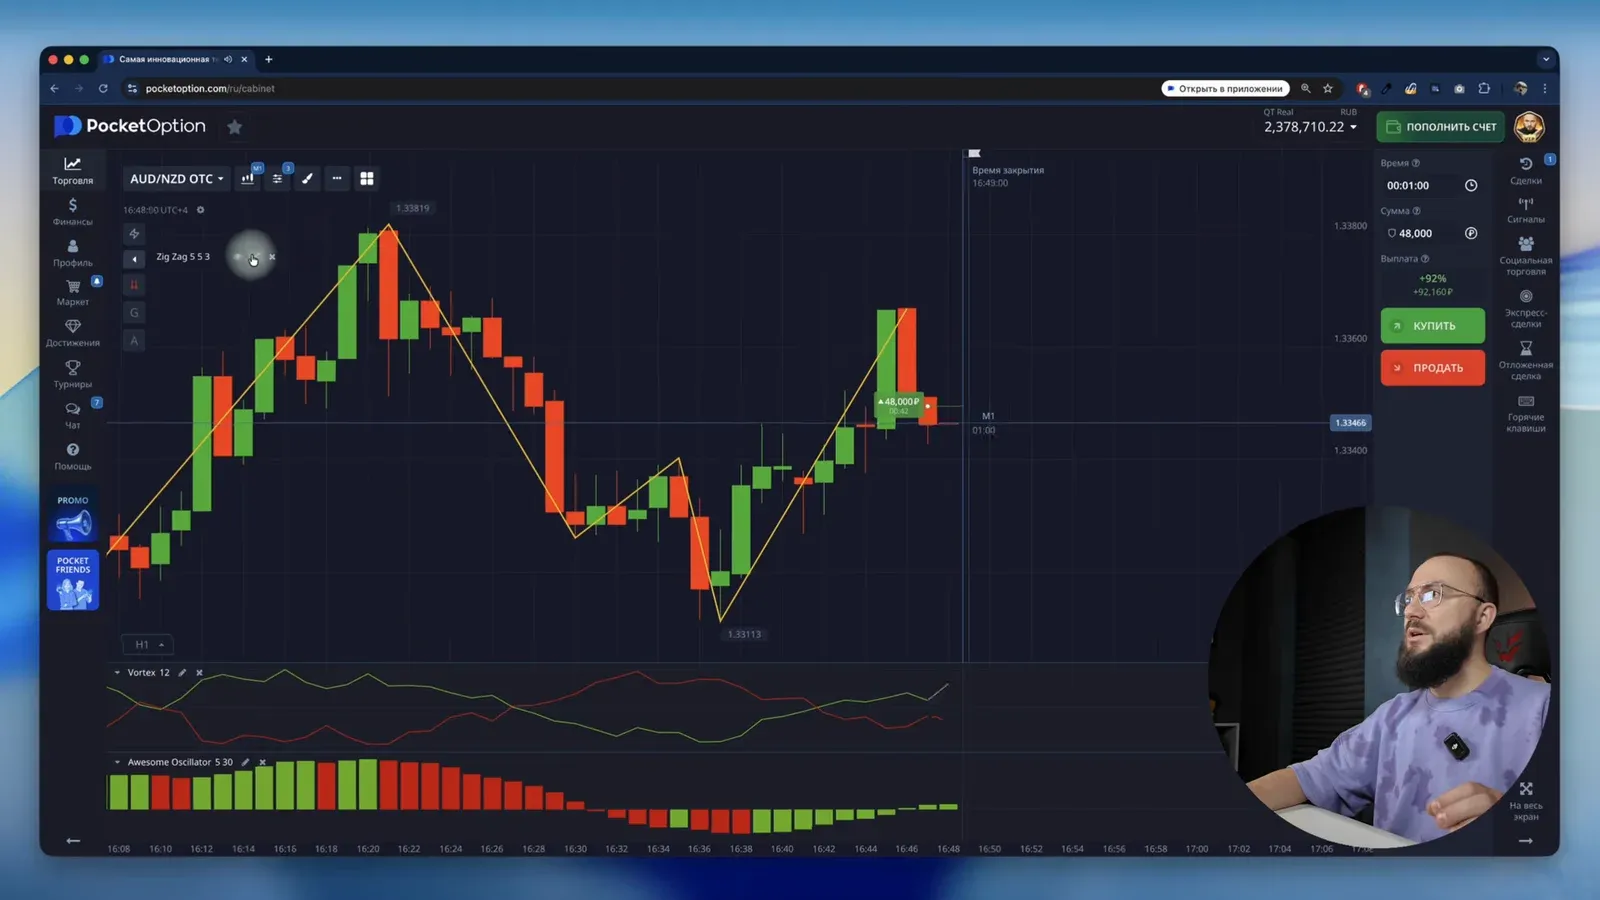
- Indicators out of sync. ZigZag says up, AO is red, Vortex is green: skip the situation and look for another asset.
- "Frozen" candles. Small bodies at one level with no market reaction: better wait for an impulse candle and see where it goes.
- A reading changes during a series. If after a loss any of the three indicators redraws against the trade, no more recovery trades on that asset. Move to another chart and start from the first amount.
- A range. In a range price moves from boundary to boundary; if the entry lands at an edge the trade closes as a win more often, but the strategy itself is built for trending moves.
Deposit allocation in the video
The author trades by martingale with compounding: the first trade is 1% of the current deposit, and as the deposit grows so does the first trade. At the time of recording that is ₽23,000 on a ₽2.3 million deposit.
| Step | Amount | Coefficient |
|---|---|---|
| 1 | ₽23,000 | — |
| 2 | ₽46,000 | ×2 |
| 3 | ₽92,000 | ×2 |
| 4 | ₽230,000 | ×2.2–2.3 |
| 5 | ₽500,000 | ×2.2 |
| 6 | several trades of ₽400,000 | ₽500,000 per-trade limit on the VIP plan |
Why the coefficient grows: at a 92% payout, doubling covers the accumulated loss only on the second and third steps; after that 2.2–2.3 is needed. At payouts around 80% the author recommends 2.2–2.5 from the start.
The session from the video
- An early sell on narrowing Vortex lines while the broader move was still up. Loss. The author's comment: stepped outside the strategy, the green Vortex line was still on top.
- A recovery sell with a new candle. A win on the second attempt, the series is covered.
- A buy on a new asset: Vortex widening upward, AO green, ZigZag up. Win. Two more buys on the same asset follow while all three indicators hold direction, both wins.
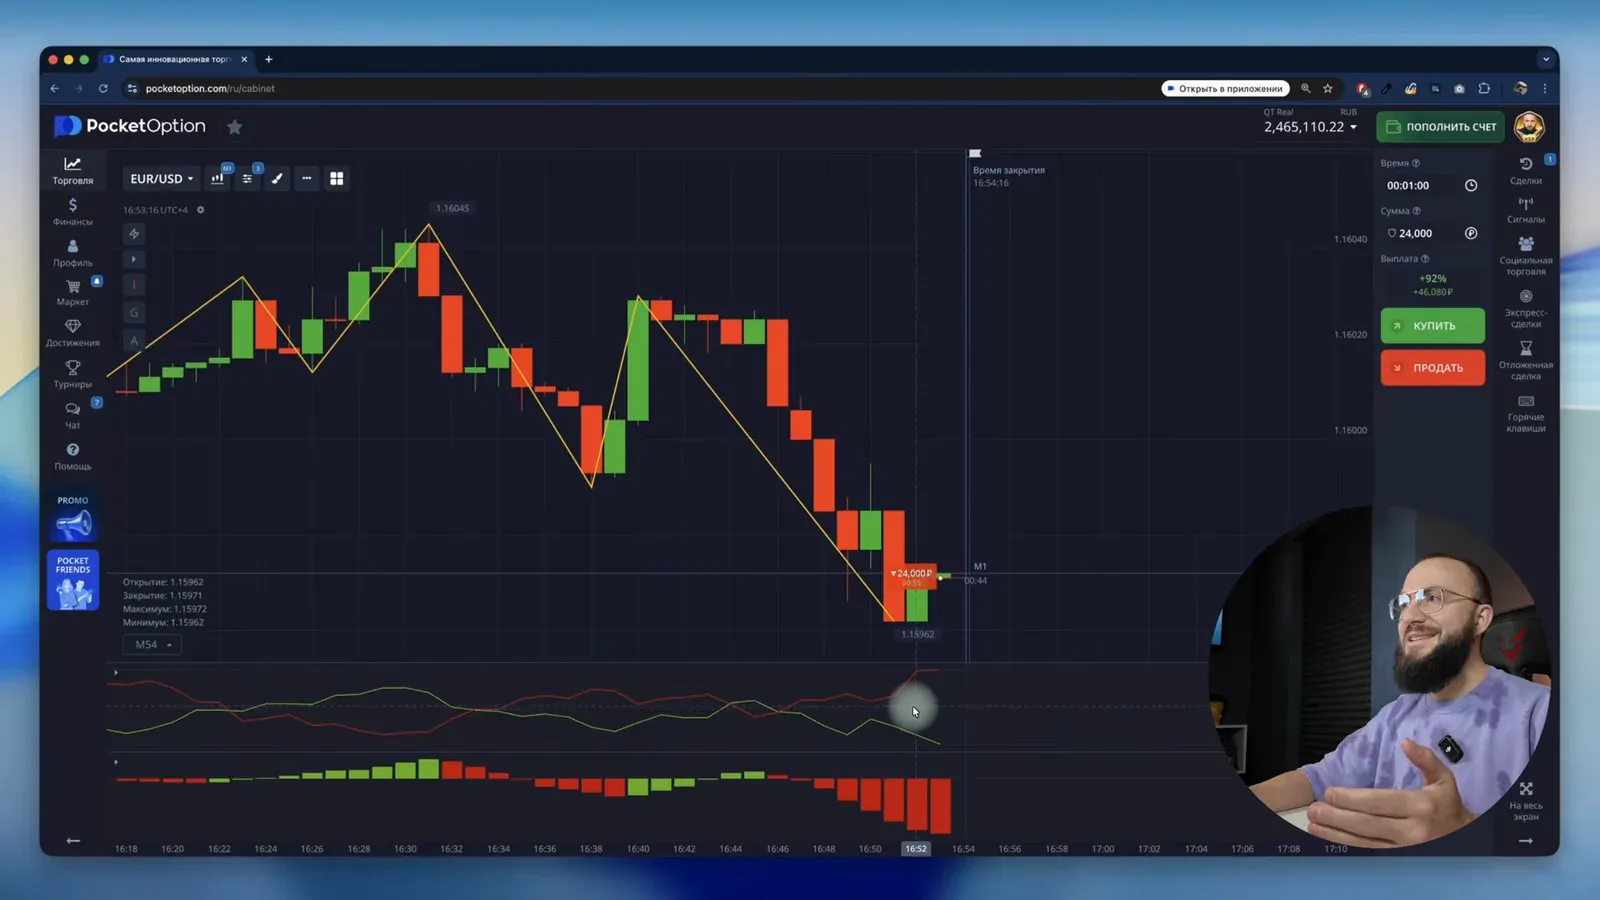
- A sell on EUR/USD (an exchange asset): ZigZag down, red Vortex line on top, AO red. The recovery trade on the second candle closes as a win despite one green bar in the AO.
Over the recording: the first trade a loss, then a run of wins with one recovery trade; the deposit reaches roughly ₽2.5 million. The author says twice that working for him does not mean it will work for everyone, and that in this strategy losses are covered by recovery trades, not eliminated.
Before you test it
- Demo account. The video ends the way it starts: this is teaching material, not a call to open a real account.
- Three AO bars is a rule, not a suggestion. After the histogram is broken by a bar of the other color, the author waits for three new bars.
- Recovery trades are the risk. The author says it plainly: trading binary options without recovery trades is harder, but recovery trades are also the fastest way to lose a deposit when the rules are broken.
- Per-trade limit. On the author's plan it is ₽500,000; the last step has to be split into several trades. Check the limit of your own plan in advance.
FAQ
What if one of the three indicators changes its reading during a series?
Stop taking recovery trades on that asset. If ZigZag redraws in the other direction or the Awesome Oscillator shows momentum against the trade, the author moves to another chart and starts there from the first amount.
Why a multiplier of 2 on the first steps and 2.2 or 2.3 later?
At a 92% payout, doubling covers the previous losses only on the second and third steps. After that the accumulated loss grows faster, and the coefficient has to be raised to come out ahead. At payouts around 80% the author suggests 2.2–2.5 from the start.
Do I need BinoView Supercharts for this strategy?
No. In the video the trading happens on the standard Pocket Option platform, where ZigZag, Vortex and Awesome Oscillator are part of the built-in set. BinoView Supercharts has the same indicators in its script catalog, and the progression can be run through the trade manager.