Order Blocks and Volume Profile Strategy for Binary Options: Smart Money in Plain Words
A manual M1 strategy on two BinoView Supercharts indicators: Order Blocks draws the zones where a position was built before an impulse, Volume Profile shows horizontal volumes and the point of control. What the zone colours mean, why an order block on the POC makes a level stronger, entry and skip rules, news and a breakdown of a real-account session: three $150 trades, three wins and +$409.50.
 Nick 8 min read
Contents
A common beginner mistake is a trade "out of nowhere": price is going up, we press up, and a minute later it reverses. This strategy answers the question of where to open a trade: only at a zone where the market has already shown interest. The zones are drawn by an order blocks indicator, and the volume profile shows at which prices the most trading took place. Below are the Smart Money idea without the mystique, what the zone colours mean, the entry and skip rules and a breakdown of a real-account session: three $150 trades and three wins.
Smart Money in plain words
Smart Money is not an indicator but a way of explaining price movement through the actions of large participants: banks and funds. The logic goes like this. A large participant needs to buy a lot, but buying everything at once at one price would send price flying up and ruin their own entry. So the position is built in parts, slowly and in one place: on the chart this looks like a sideways range with heavy volume. The last candle against the move before a sharp impulse is the order block — the zone where, by this logic, the position was being completed.
Why price returns to the zone: it is assumed that not everything was filled, some orders stayed open, and when price comes back the participant will defend the zone again. Such zones are also where the stops of careless traders are often swept: a poke beyond the edge and a reversal.
An important caveat: this is a model, not an observation. The orders of a large participant are not visible on the chart, and nobody guarantees the zone will be defended. Only the price reaction confirms an order block. That is why in this strategy a zone is the place where we wait for a signal, not a signal in itself. How the indicator finds the source candle and builds the zone is covered in detail in the Order Blocks indicator overview; we do not repeat that theory here.
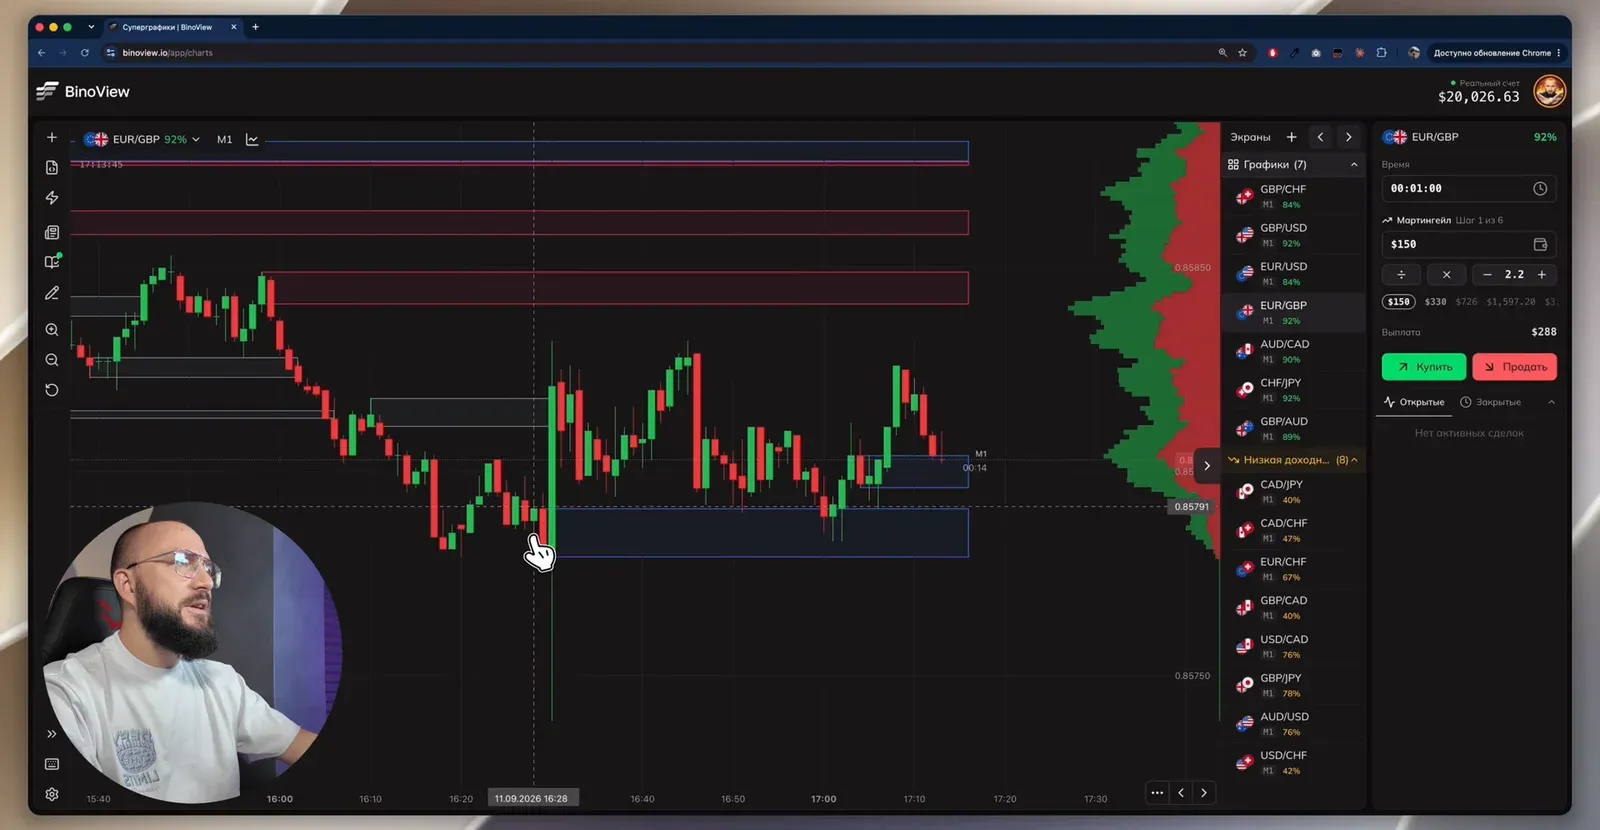
Two indicators on the chart
Order Blocks draws zone rectangles. In the settings each zone state has its own colour; in the video they are:
| Zone colour | What it is | How we use it |
|---|---|---|
| blue | the zone has already given a reaction: a touch or a bounce | a working zone: buy from it below price, sell from it above |
| green | a buy zone, no reaction yet | wait for price to come down to it and buy |
| red | a sell zone, no reaction yet | wait for price to come up to it and sell |
| grey | the zone is used up or broken, left behind | do not trade |
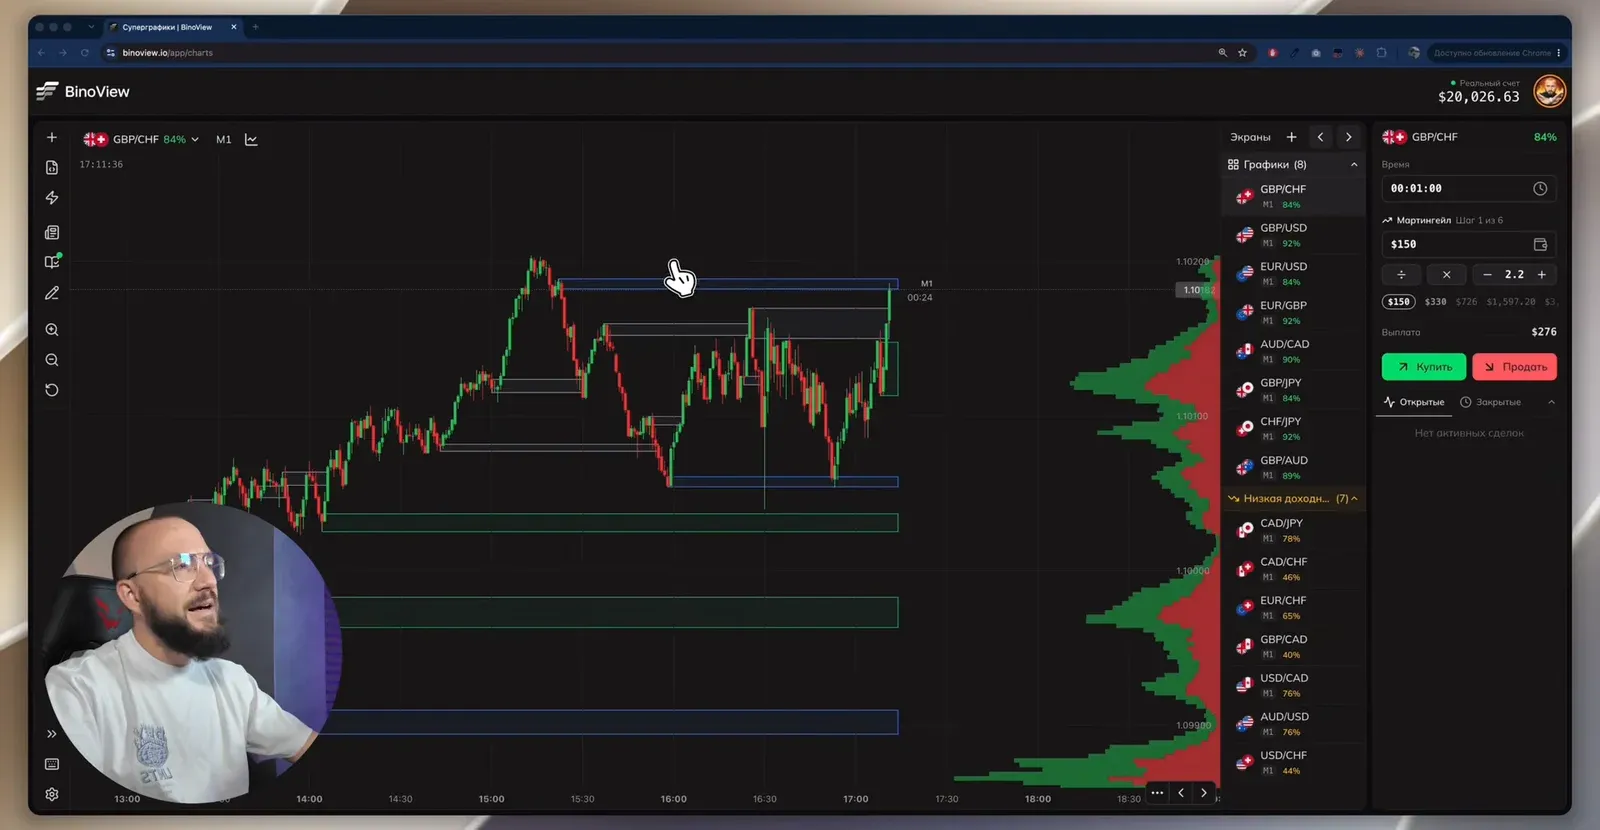
Volume Profile is horizontal volume, the histogram on the right of the chart. Each bar shows how much trading happened at that price; the bar is split into a green and a red part. The longest bar is the point of control (POC): the price where the most trading took place. On the chart it is marked with an orange dashed line. The profile shows trading volume, not stops or orders.
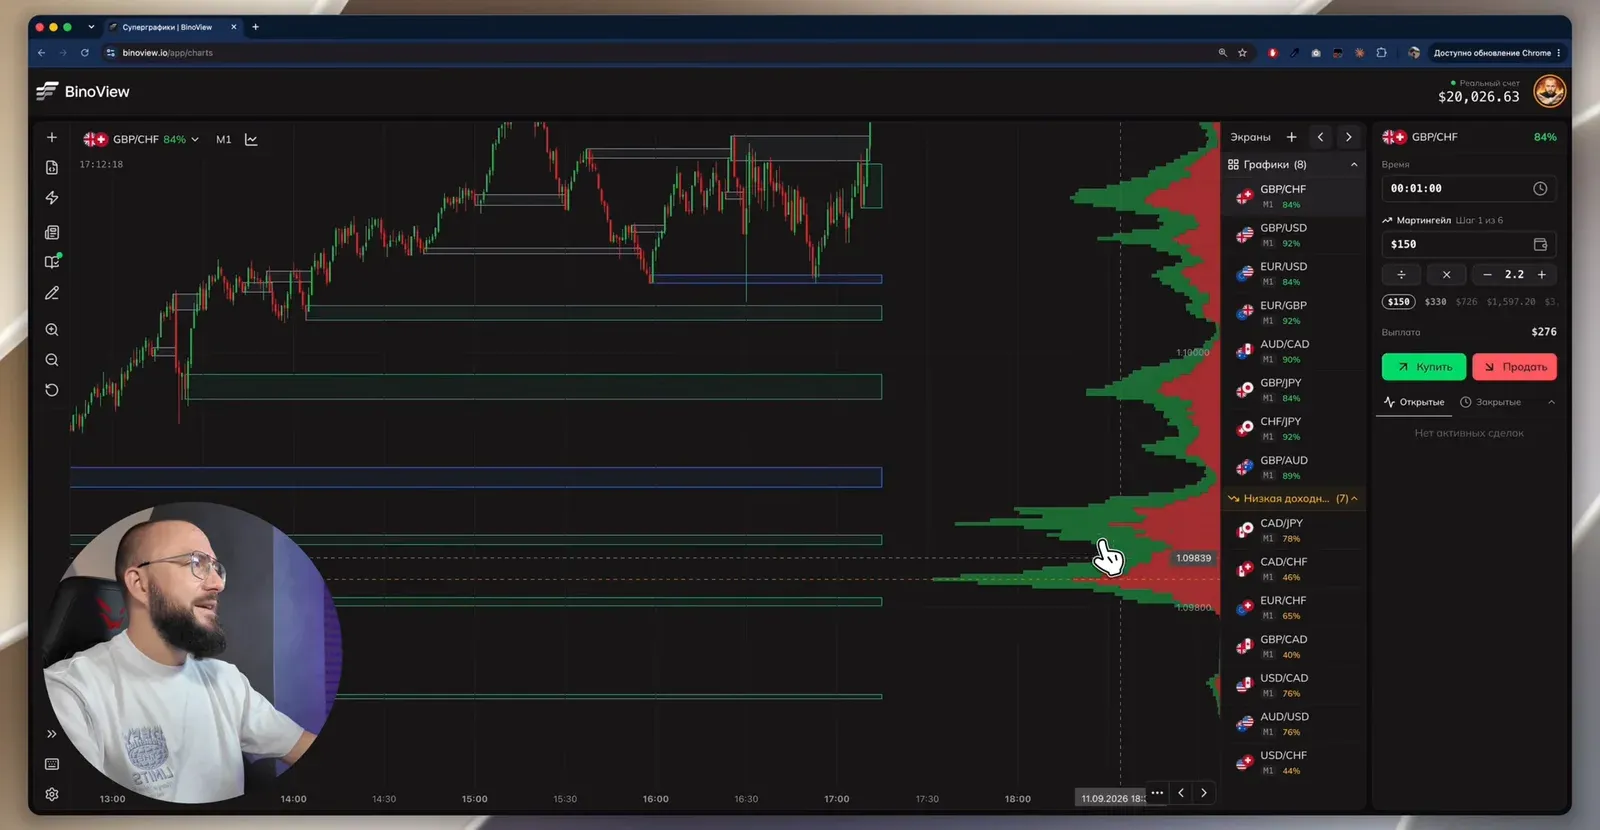
Order Blocks and other tools — in BinoView Supercharts
An order block on the POC
The main idea of the strategy: an order block on its own can be random, but an order block at a large volume cluster says the place matters to many participants. If an order block lies on the POC line, we are looking at a strong support or resistance level. The larger the volume at the zone, the higher the probability of a reaction — a probability, not a guarantee.
On EUR/GBP in the video the POC matched the zones above price: that is resistance, and on an approach from below we look for sells there.
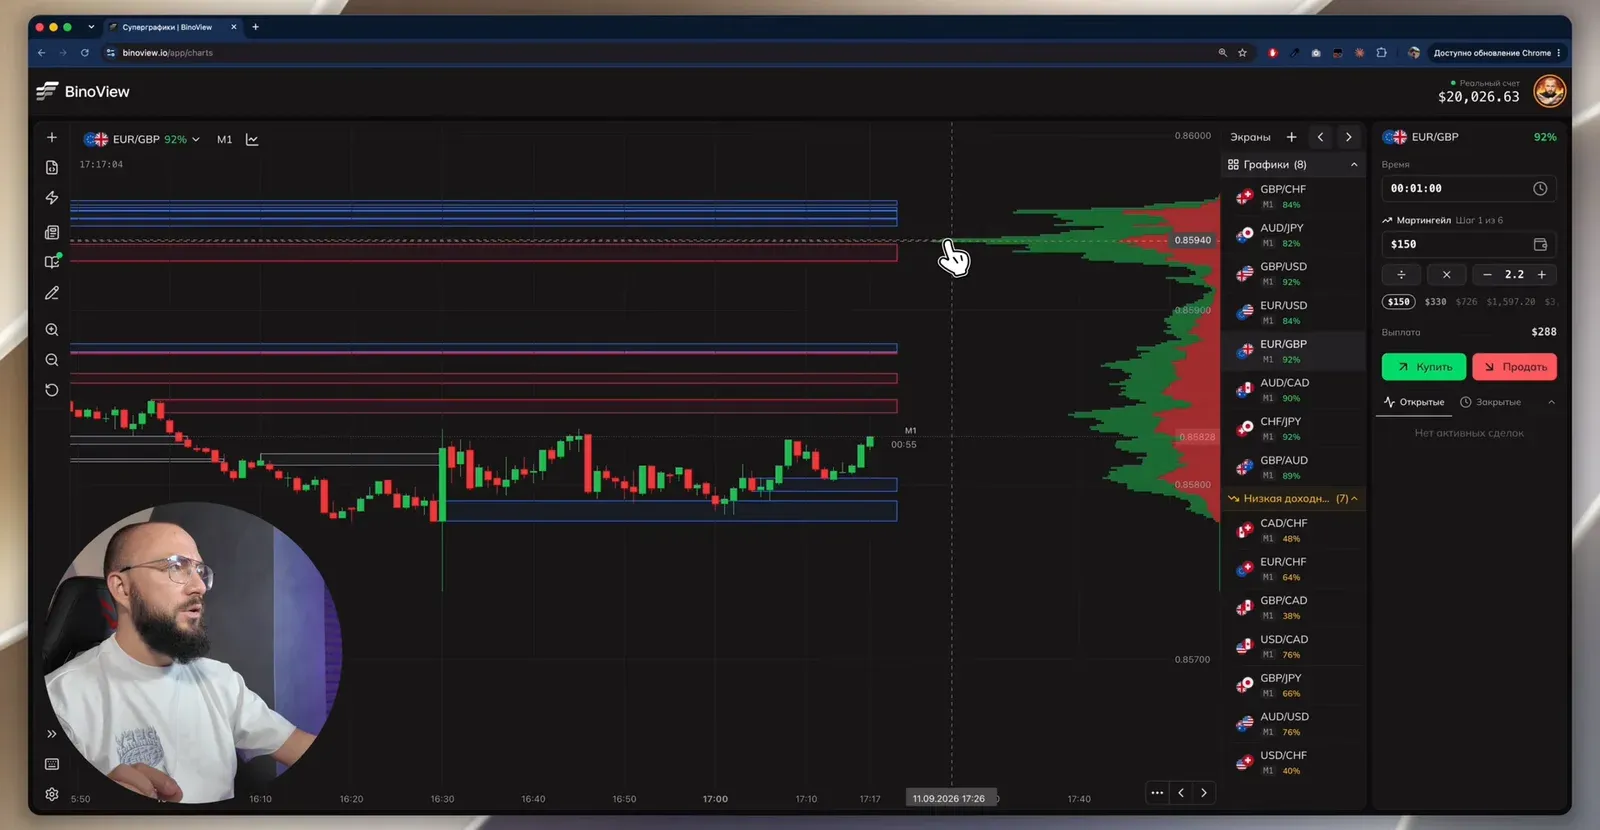
One platform limitation: in Supercharts the profile is built from the history on the chart, about 1,000 candles. If there are no volume clusters above, we work only with the ones visible below.
Settings
| Parameter | Value from the video |
|---|---|
| Market | real Forex: GBP/CHF, GBP/AUD, EUR/GBP, GBP/USD |
| Timeframe | M1 |
| Expiration | 1 minute |
| Order Blocks | zone colours: blue, green, red, grey; the parameters were not opened in the video |
| Volume Profile | histogram on the right, the POC is an orange dashed line |
| Trade manager | martingale, first trade $150, multiplier 2.2, 6 steps |
| Series steps | $150, $330, $726, $1,597.20 and on; all six add up to $14,047.49 |
| Payout in the recording | 89–92% |
The indicator settings are not shown in the video, so start with the defaults. What each Order Blocks parameter changes and which presets suit OTC and the real market is laid out in the indicator overview.
Entry rules
| Situation | Trade | Condition |
|---|---|---|
| price came down to a green or blue zone below it, a volume cluster nearby | buy | a reaction from the zone: the wick poked out of the zone and the candle closed above it or inside |
| price rose to a red or blue zone above it | sell | a reaction from the zone: the candle closed below the zone, the previous one has a long upper wick |
| the order block matches the POC or a large volume cluster | the same trade, the best variant | a strong level |
| price has not reached the zone yet | skip | "better let the chart go without us than enter an uncertain trade" |
| important news coming out | skip | price is thrown both ways |
| the order block was drawn by a news candle | skip this zone | take only fresh zones after the news |
| the zone is grey or broken | skip | look for the next zone or another asset |
A couple of details from the video. It is better to enter at the open of a new candle: opening mid-candle worsens the entry, and then a recovery should be planned in advance. Structure matters too: if the lows are rising, a buy from a zone on a correction goes with the move, not against it. Situations do not appear every minute; they have to be waited for while switching assets.
Breakdown of the session from the video
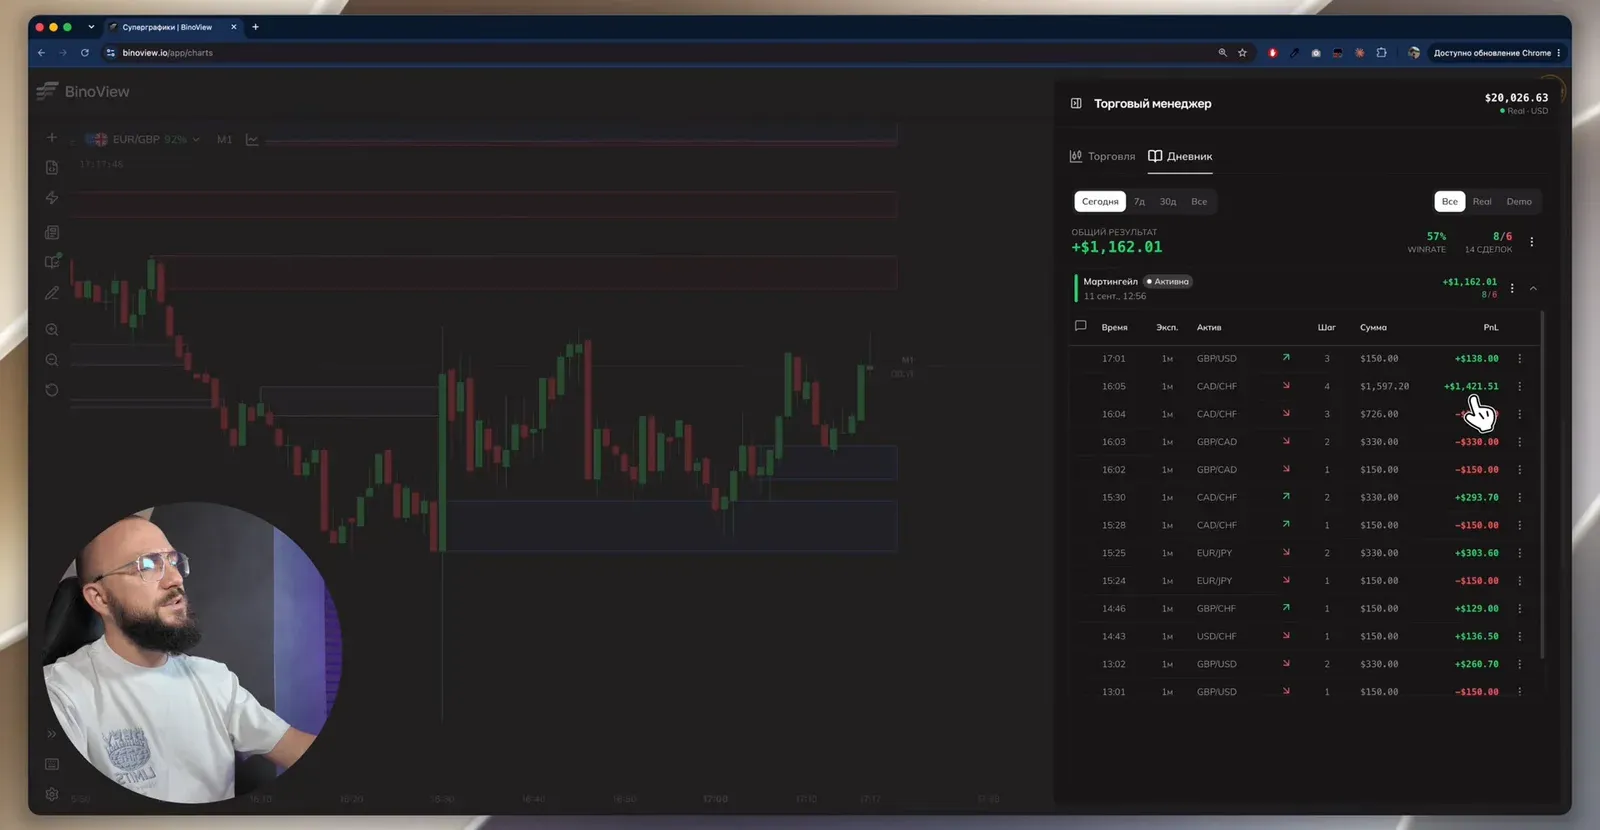
Before the recording that day there had already been 15 trades and +$1,162.01. The trade manager's journal shows the hardest series: two losses on GBP/CAD ($150 and $330), a loss on CAD/CHF ($726), and only the fourth step at $1,597.20 closed with a win of +$1,421.51. As the video puts it, order blocks were broken one after another, and the recovery worked only on the third order block in a row, on another asset.
Then the trades in the recording, all at $150 on M1:
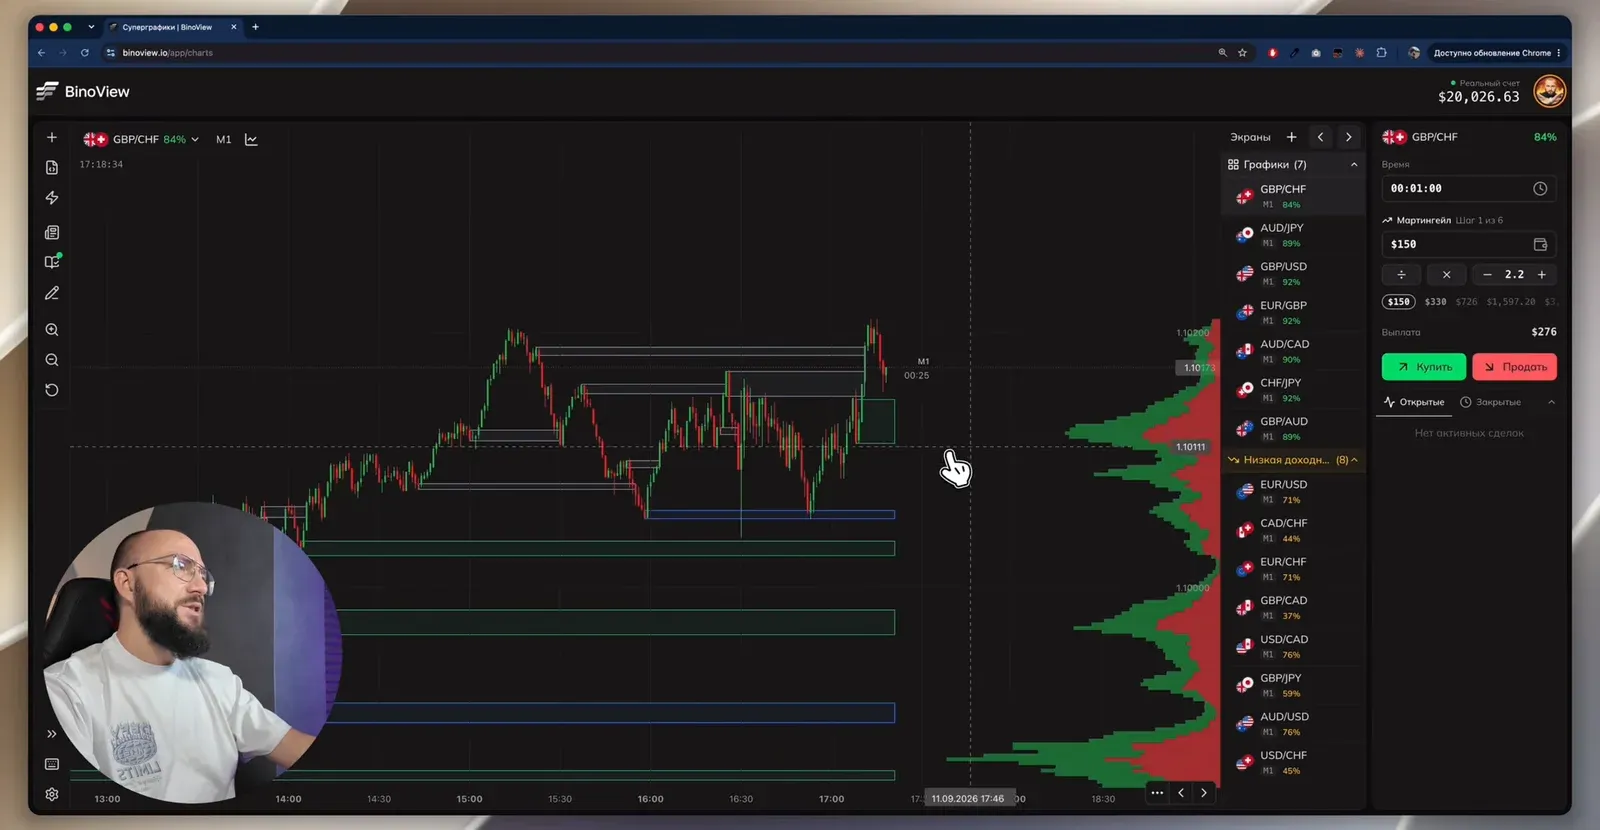
- GBP/CHF, a skip. A green zone and a volume cluster below price, but the candles have not reached them — we stay out. Later price touched the green zone and bounced: a buy was possible there on a wick poking out and a close above the zone.
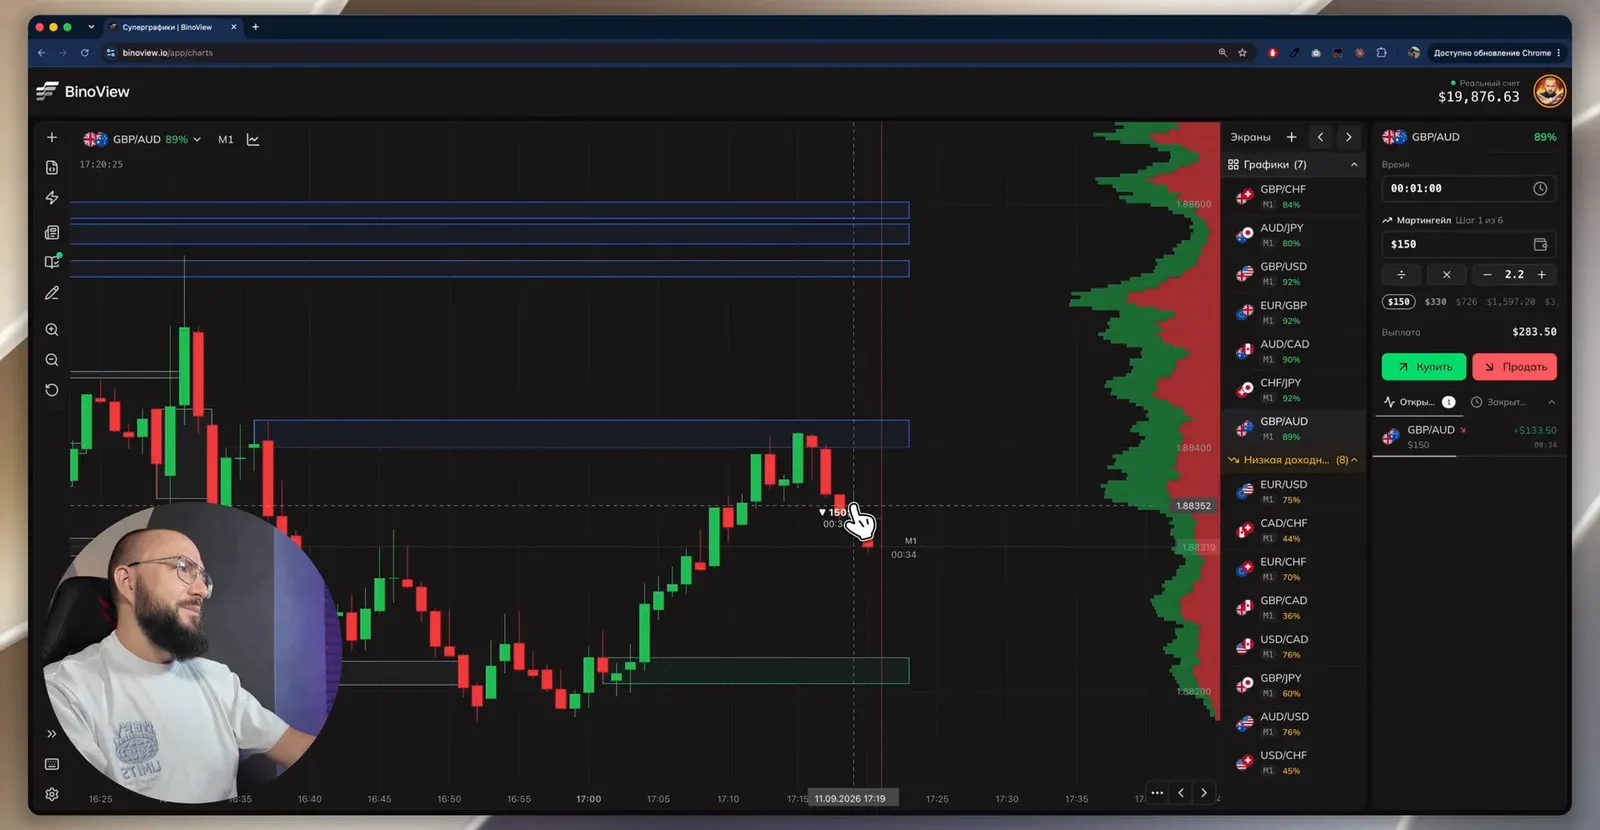
- GBP/AUD, a sell. Price rose under a blue order block that had already given a reaction. Confirmation: a red candle closed below the lower edge of the zone, and the previous green one had a long upper wick — sellers pushed through. The match with volumes is not perfect. A win of +$133.50 at an 89% payout.
- EUR/GBP, a buy. The lower order block was drawn by a news candle, so we ignore it. We enter from a fresh blue order block higher up, formed after the news, slightly before price fully reached the zone. A small volume cluster nearby and rising lows — a buy on a correction. A win of +$138.
- GBP/USD, a sell from a red zone above price. The entry is mid-candle, so the recovery amount is prepared in advance, but it was not needed. A win of +$138.
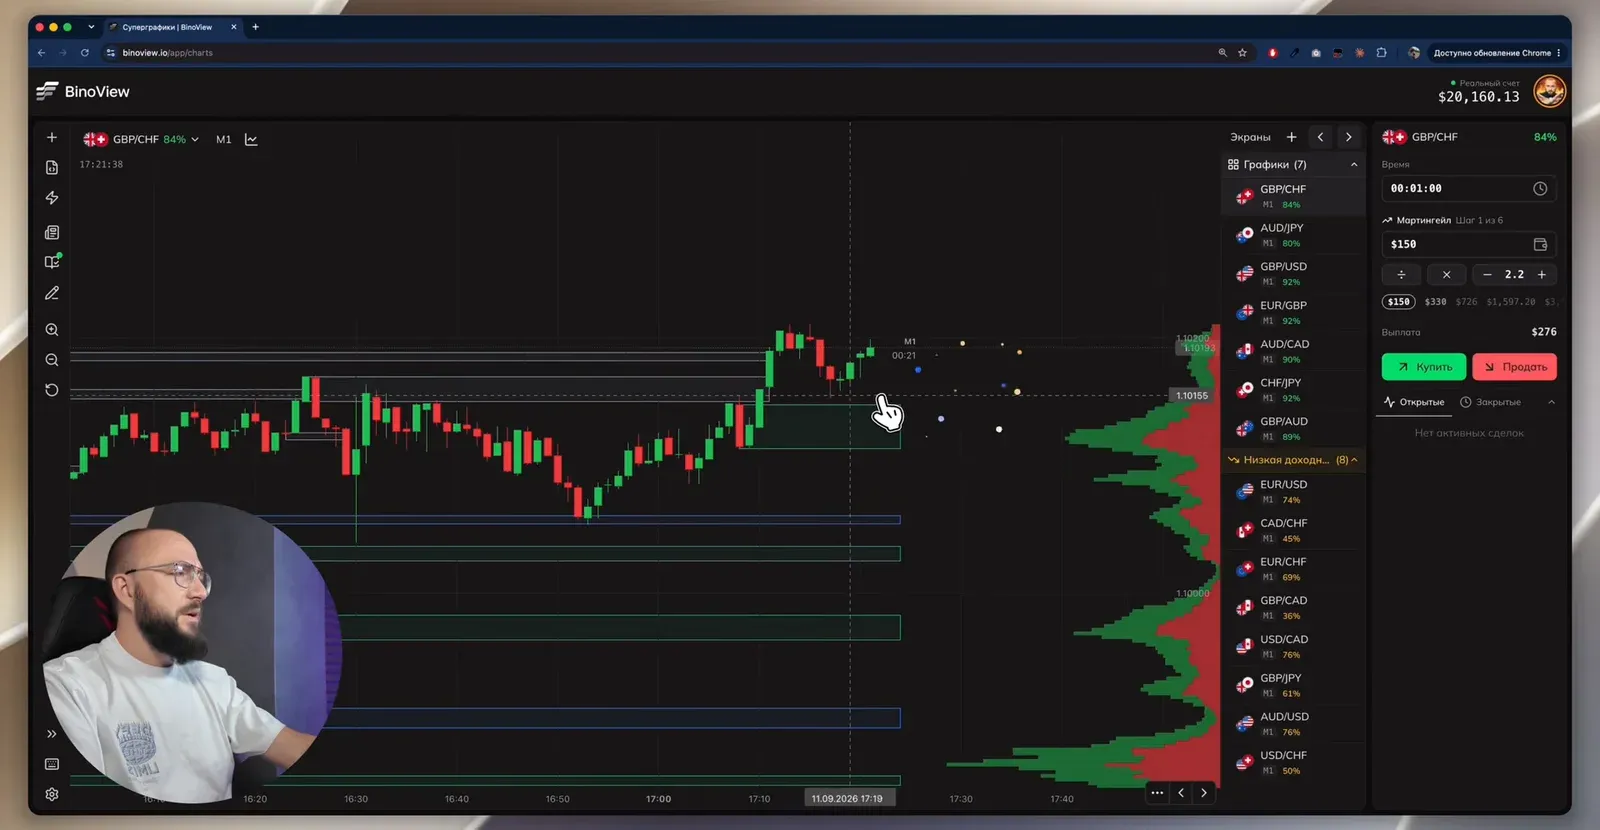
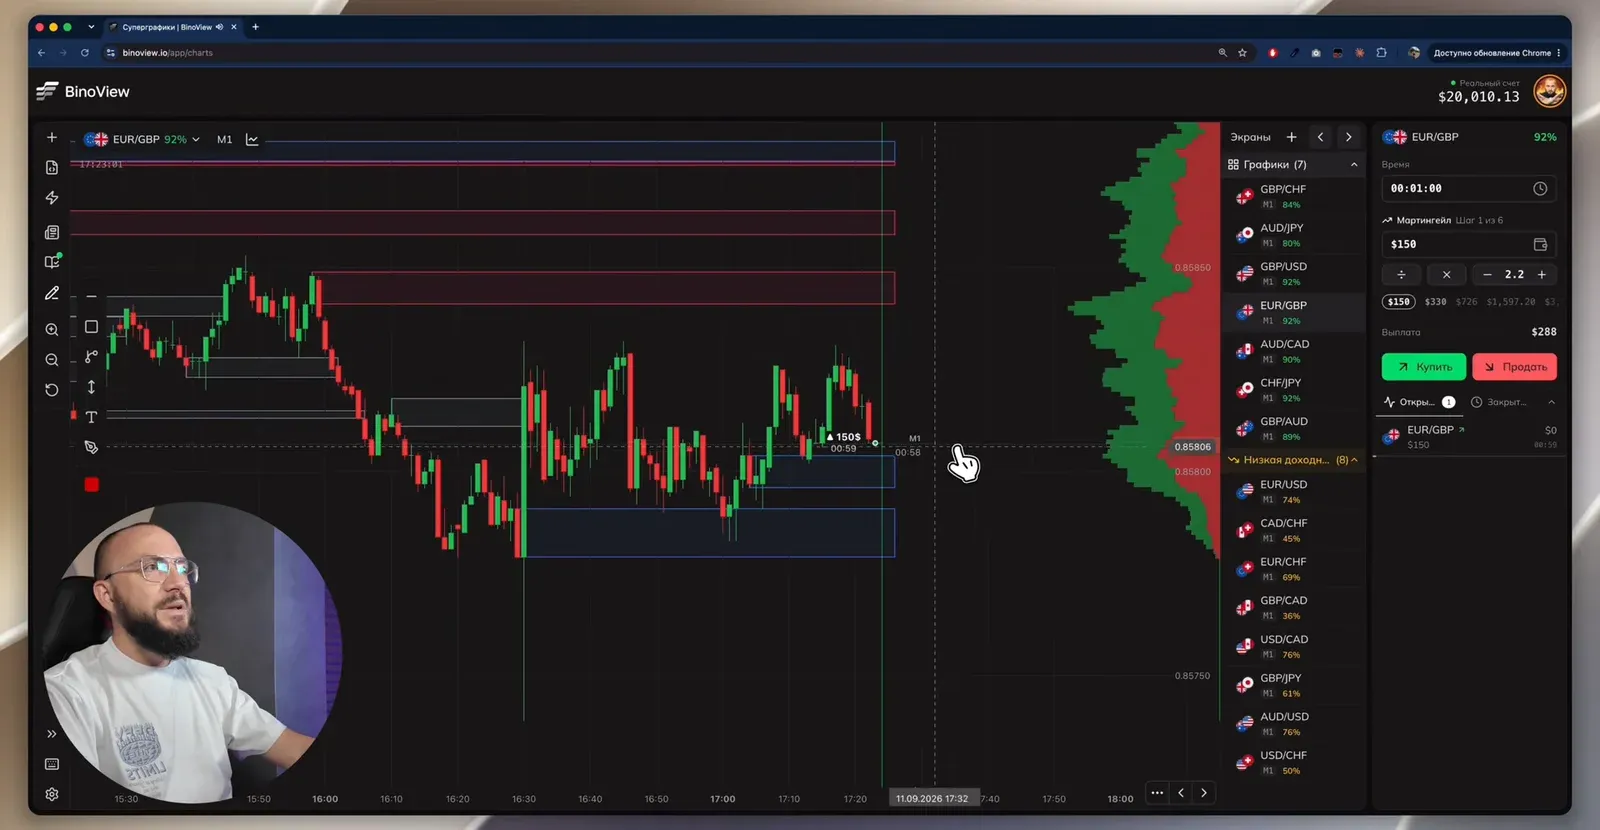
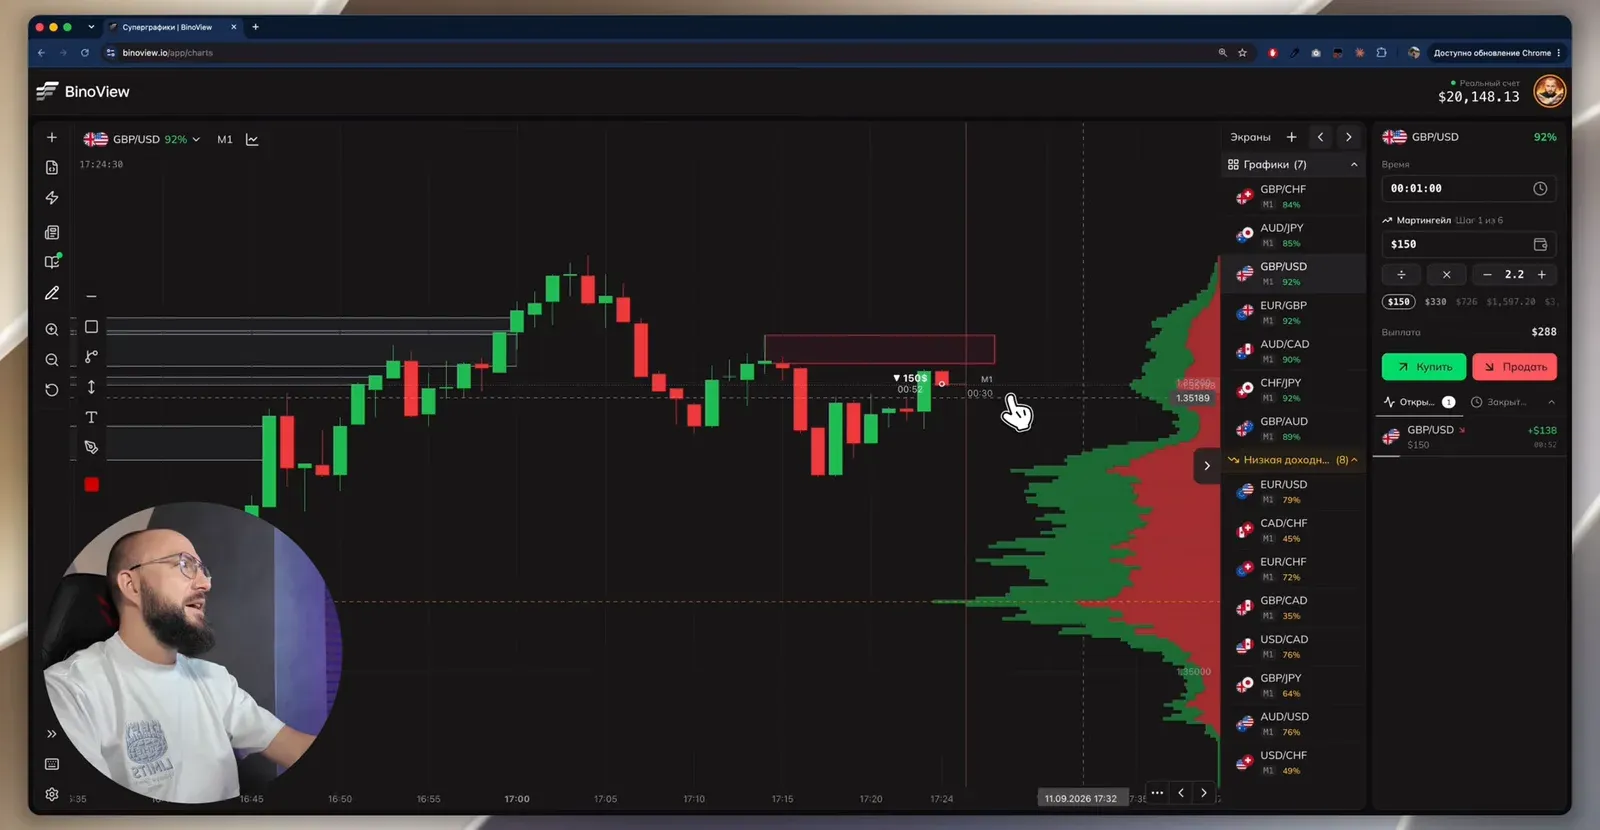
The result of the recording: 3 trades, 3 wins, +$409.50. For the day the closed trades list shows 18 trades and +$1,571.51, with a real-account balance of $20,436.13.
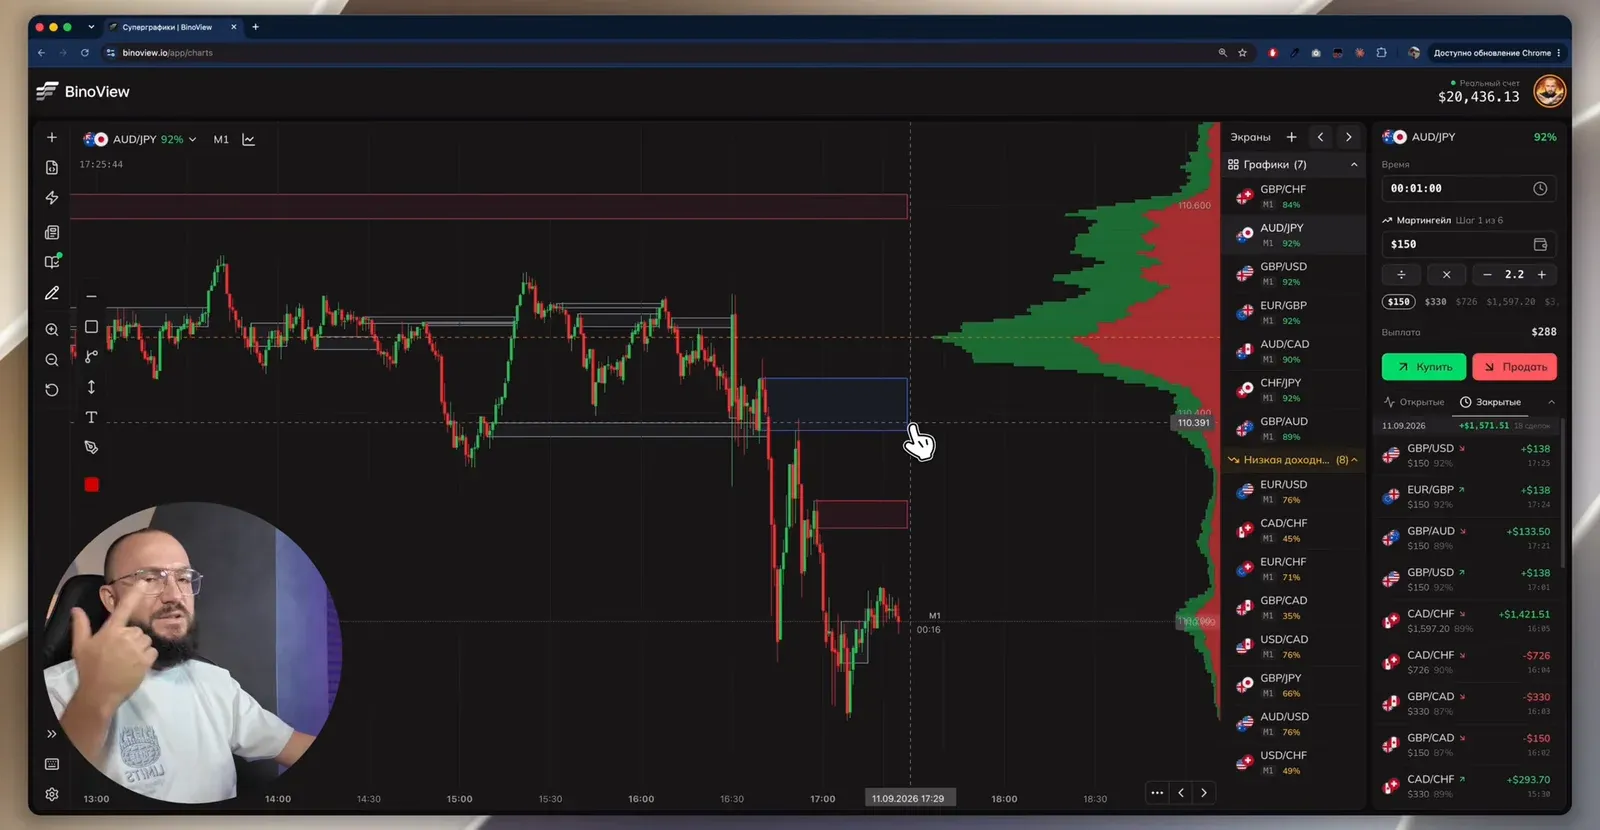
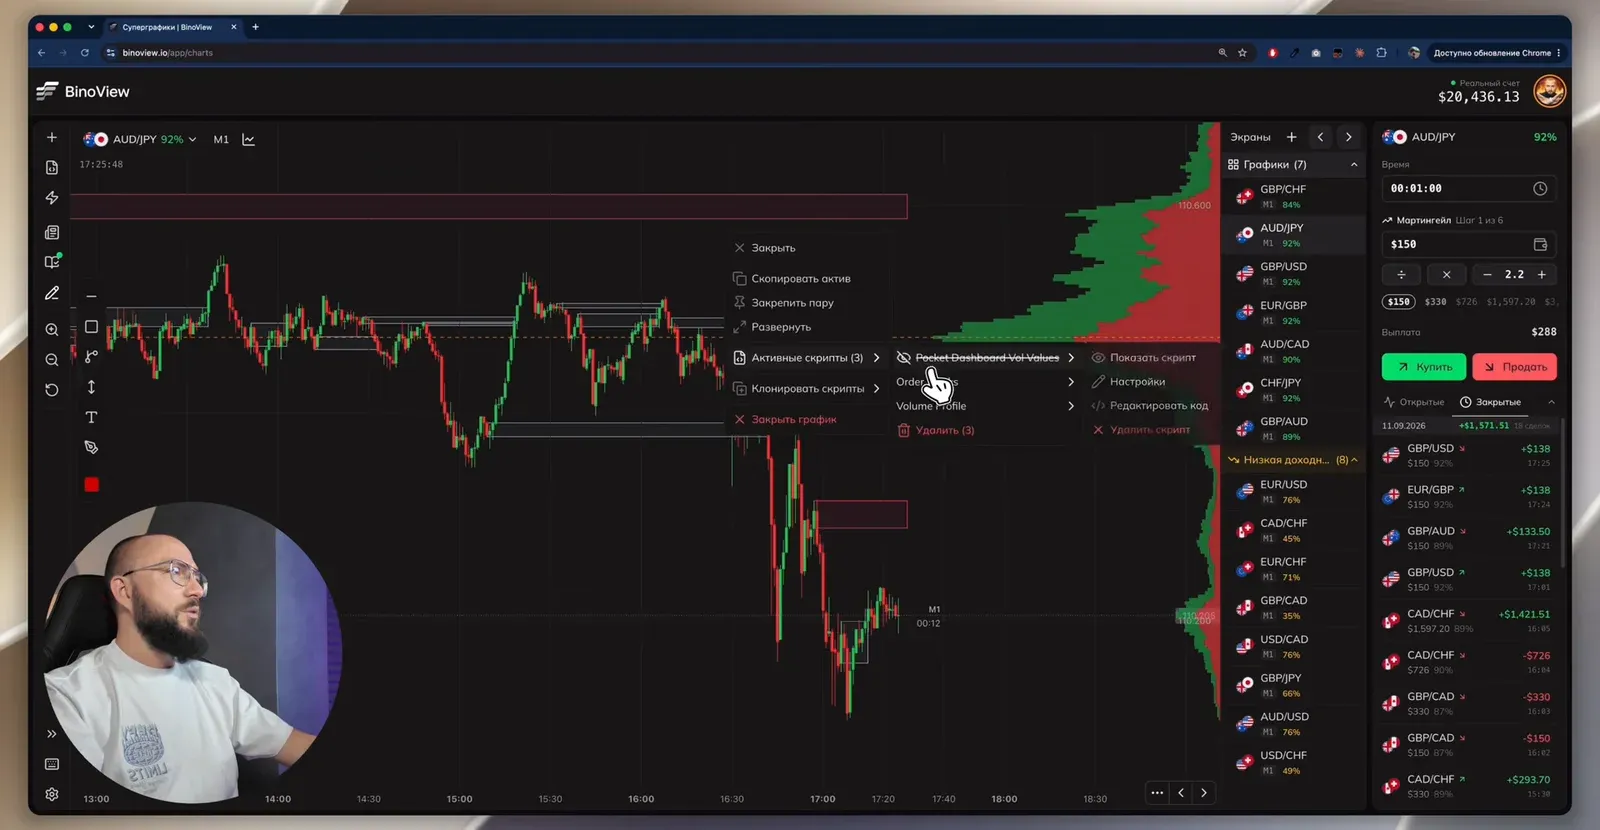
This is the result of the recording, not the expected return. Three wins in a row is a short sample, and the same day's session before the recording went to the fourth martingale step at $1,597.20. The video says it directly: an order block matching volumes raises the probability that a trade closes with a win "with one or two recoveries", but does not guarantee it. What such a series costs at your bankroll is calculated by the martingale calculator, and how many losses in a row to expect at your win rate — by the drawdown calculator.
FAQ
What is an order block in plain words?
It is the last candle against the move before a sharp impulse: the last red candle before a rise or the last green one before a fall. In Smart Money logic a large participant was building a position in parts at that spot and may have left unfilled orders there, so a reaction is expected when price returns to the zone. This is a model, not a fact: the orders are not visible on the chart, and only price behaviour confirms the zone.
Why do I need the volume profile if I already have order blocks?
The profile shows at which prices the most trading happened over the visible history. The longest bar is the point of control, the level where the market spent the most time. An order block on its own can be random, while a match with the POC or a large volume cluster says the level matters to many participants. Those are the places we pick for an entry.
Why does the strategy not work on news?
When important news comes out, price is thrown both ways and zones are broken without a reaction. An order block drawn by a news candle is unreliable too: it appeared because of a spike, not because a position was built. So we do not trade during news, and afterwards we take only fresh order blocks formed by a calm market.
Author
Nick
Runs the «Много денег» YouTube channel, editor of the Academy BinoView blog.