Levels + CCI 1-Minute Strategy for Pocket Option: Manual Trading From a Smartphone
A manual counter-trend binary options strategy on two indicators: automatic support and resistance levels (Average Support Resistance) and CCI. The rules by level colour, selling at resistance in overbought and buying at support in oversold, which charts to skip, a recovery on another asset at coefficient 2.2, and a breakdown of a smartphone session: 11 trades and +58,729 ₽ for the day.
 Nick 9 min read
Contents
A video about going back to manual trading: bots are convenient, but they make you complacent, and the foundation of reading the chart should remain. The strategy is the simplest possible: automatic support and resistance levels plus the CCI oscillator, a 1-minute chart, a 1-minute expiration. It can be traded from a phone; in the video the whole session runs in the mobile version of Supercharts. Below are the rules by level colour, the entry table, which charts to skip and a breakdown of a session that started with two losses and ended at +58,729 ₽.
The idea of the strategy
The strategy is counter-trend: we look for a place where the move runs into a level while the oscillator shows it is overheated, and open a trade for one corrective candle. Nothing more is needed: the indicator draws the levels, CCI shows the zone, and the trader's job is to switch between charts and wait for the two conditions to coincide.
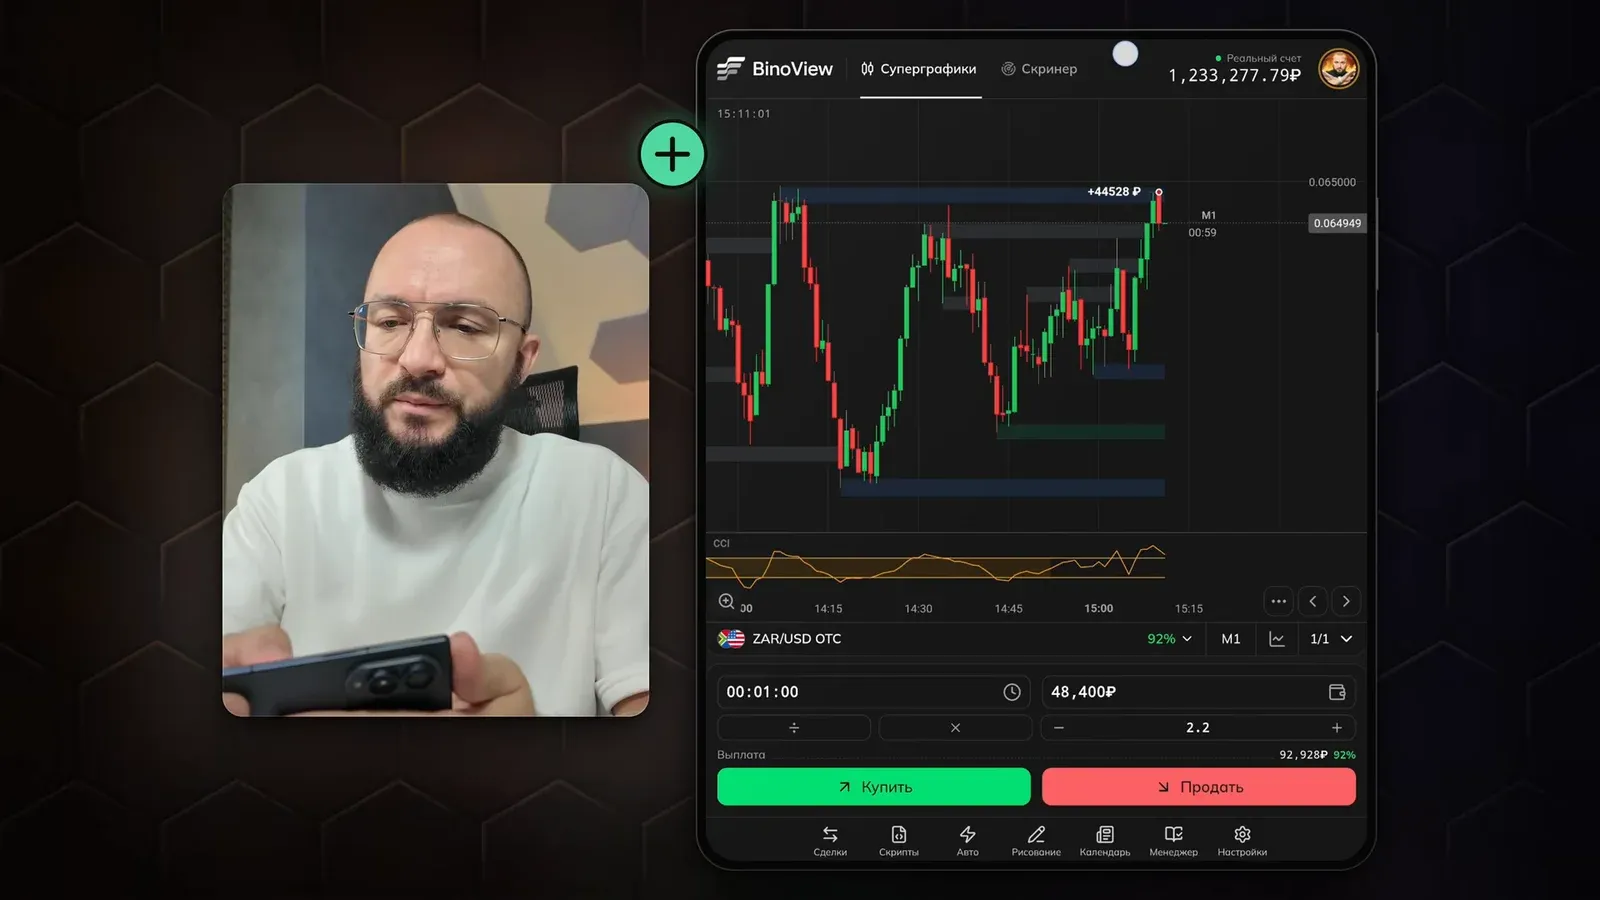
On the 1-minute timeframe one candle in the right direction is enough for a win, so the expiration is one minute and the entry is at the open of a new candle. If the candle has already moved away from its open, the entry gets worse: in the video one such trade closed as a loss precisely because it was opened "above the open" on an active candle.
The two indicators
Levels are drawn automatically; nothing needs to be drawn by hand. The colour of a level says what has happened to it:
| Colour | What it is | How we use it |
|---|---|---|
| blue | a level that has already produced a bounce | the main level for entries: buy from below, sell from above |
| green | support, no reaction yet | buy on the approach |
| red | resistance, no reaction yet | sell on the approach |
| grey | a broken level | not traded, price moves to the next one |
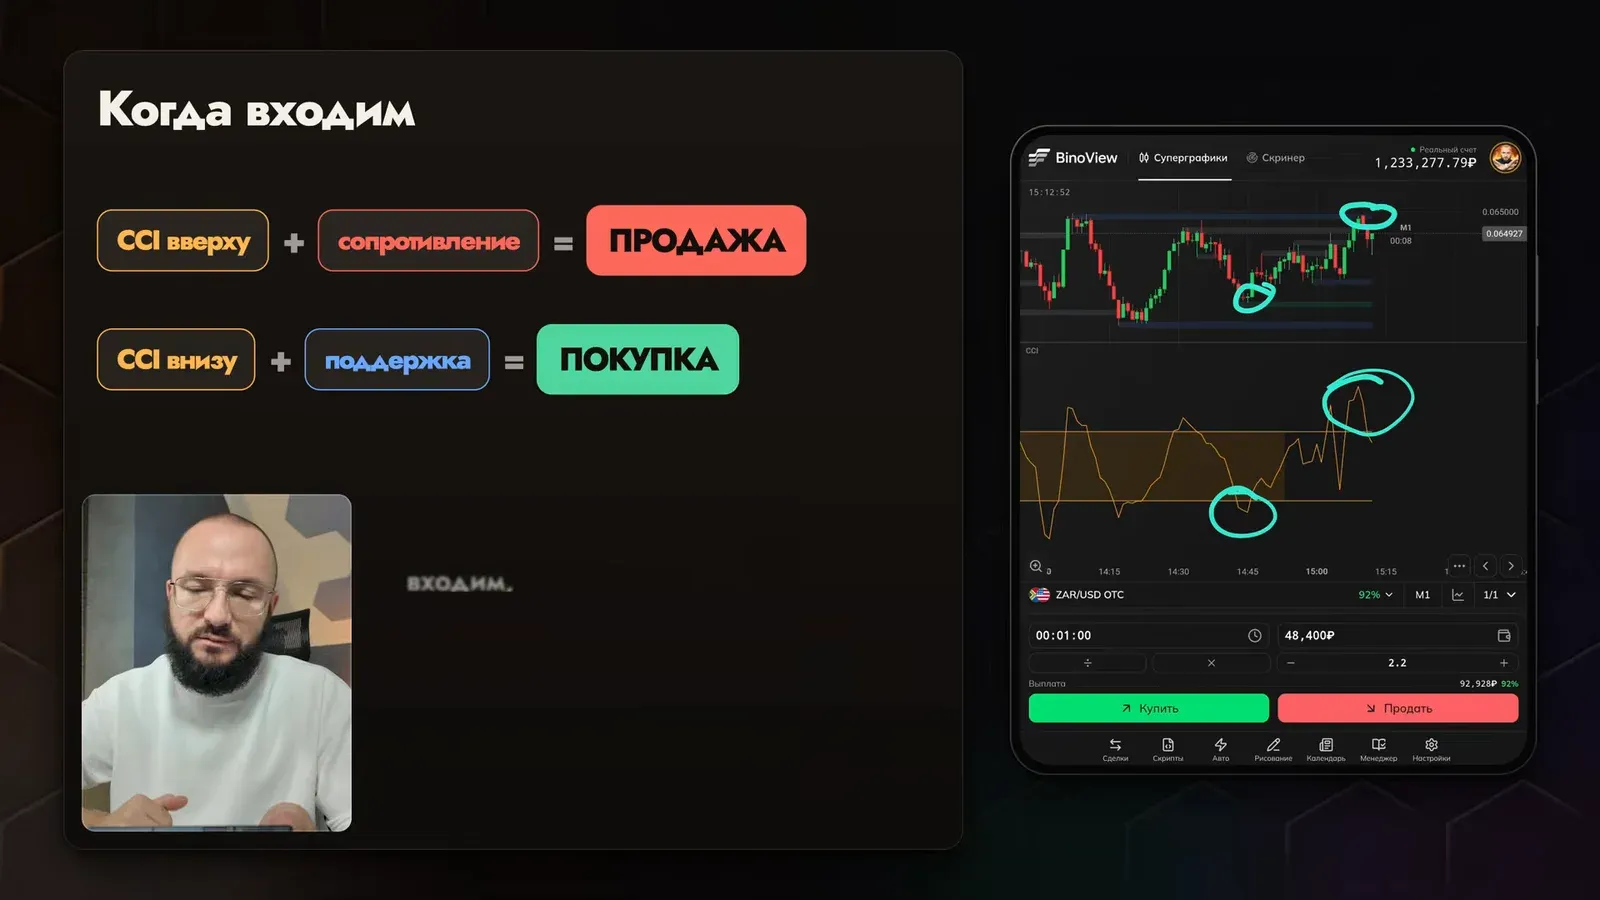
CCI sits below the chart and shows overbought and oversold: the line above the upper band means the market is overheated up, below the lower band overheated down. On its own, leaving the band means nothing; it only matters paired with a level.
Average Support Resistance and other tools — in BinoView Supercharts
Settings
| Parameter | Value from the video |
|---|---|
| Timeframe | M1, M5 to check the level |
| Expiration | 1 minute, entry at the candle open |
| Indicators | Average Support Resistance, CCI with standard lines |
| Market | OTC and Forex; in the video ZAR/USD OTC, GBP/CAD, AUD/CAD OTC, USD/RUB OTC, CAD/CHF OTC, EUR/RUB OTC |
| Payout | 92% on every asset in the recording |
| Trade amount | 10,000 ₽ |
| Recovery | coefficient 2.2, the second step on another asset |
| Screens | one, switching between assets by hand |
Entry rules
| Situation | Trade | Condition |
|---|---|---|
| price at blue or red resistance, CCI above the upper line | sell at the open of the next candle | no extended rise, the level is not broken |
| price at blue or green support, CCI below the lower line | buy at the open of the next candle | no extended fall, the level holds |
| a candle bounced off resistance and closed red | sell one candle later | CCI still overbought |
| a strong impulse fall into a blue level, green nearby | buy | CCI oversold, the same level on M5 |
| the level is broken and has turned grey | skip | no more entries on this asset |
For confirmation you can switch to M5: in the video, before the buy after an impulse fall, the 5-minute chart shows the same support and the same CCI in the oversold zone, and the trade closed as a win.
Which charts to skip
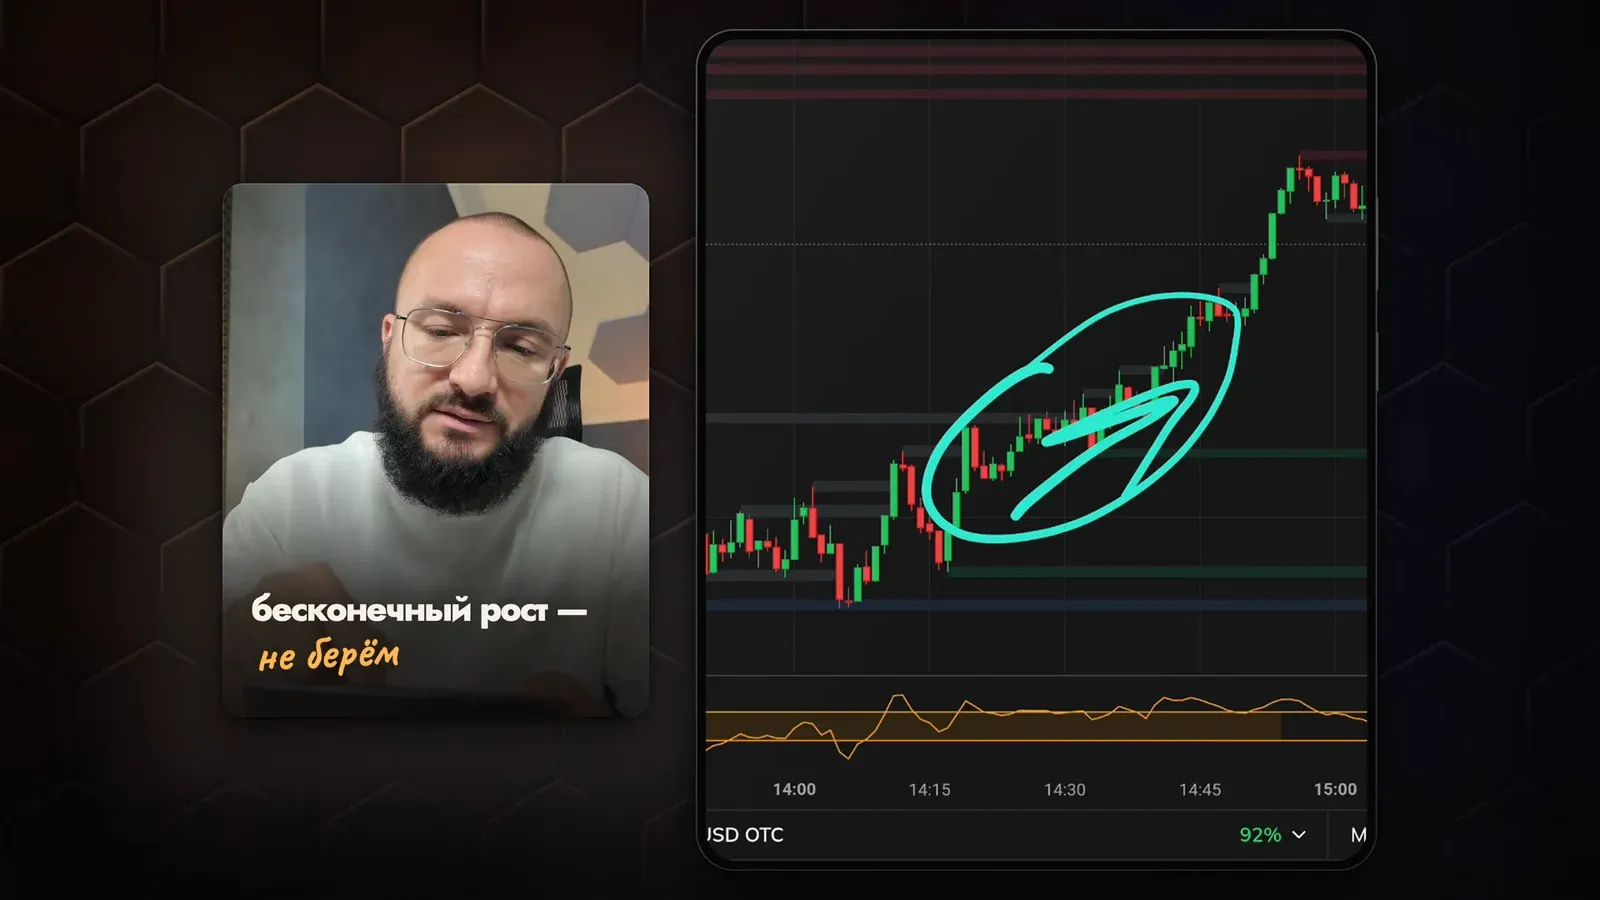
The strategy's main trap: a chart that flies in one direction for a long time. It shows oversold or overbought on CCI, but there are no confident levels, only grey stripes of broken ones. This is a trend with weak volatility, and an entry against it gives a run of losses. We do not take such assets at all, even if the oscillator is "screaming".
We need volatile charts where price moves up and down between levels: in the video these are ZAR/USD OTC and KAS/USD. Two more restrictions:
- after a strong move we do not try to "win it back" on the same asset in either direction: after a run-up a range or a correction may begin, and both trades would be guesses;
- on OTC be more careful in the hours when there are few traders: the chart is synthetic, and in thin stretches it behaves worse.
Recovery: one on the same asset, the second on another
After a loss the next trade opens with coefficient 2.2: 10,000 → 22,000 → 48,400 → 106,480 ₽. The trade panel of the mobile Supercharts has "×" and "÷" buttons next to the amount for this; one tap changes the step. The rules from the video:
- The first recovery can be taken on the same asset if the level holds and a new candle has appeared.
- If the level is broken, we leave the asset. The second step is sought on another chart: this is the "double recovery on another asset".
- No situation, no trade: the loss stays, and the recovery waits for the next coincidence of a level and CCI.
What such a chain costs at your bankroll is shown by the martingale calculator: four steps at coefficient 2.2 need 186,880 ₽ at a 10,000 ₽ base.
Breakdown of the session from the video
- ZAR/USD OTC. Two sells from blue resistance closed as losses (10,000 and 22,000 ₽), the third from a new candle at 48,400 ₽ gave +44,528 ₽. Result of the stretch: three trades, two losses, one win.
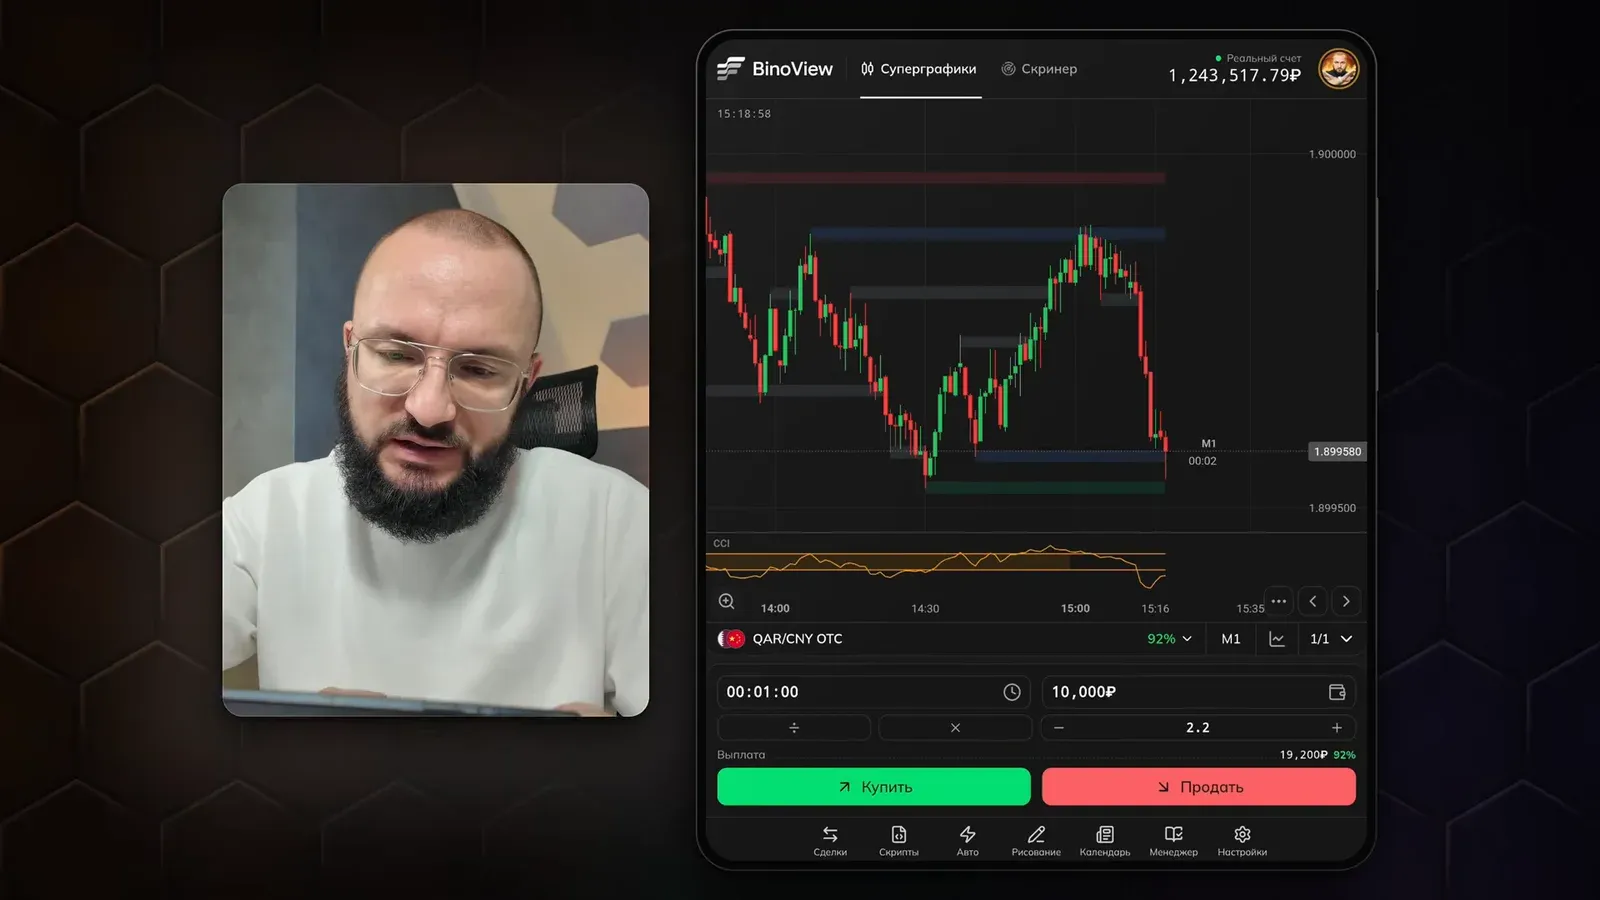
- GBP/CAD. A 10,000 ₽ sell from blue resistance with CCI overbought, but on an active candle and above its open. The level is broken and turns grey, a loss. No more entries on this asset.
- AUD/CAD OTC. A double recovery of 22,000 ₽ to sell: blue resistance, CCI overbought, no clear trend. A win.
- A buy after an impulse fall of 10,000 ₽: a blue level, green nearby, CCI oversold, the same on M5. A win.
- USD/RUB OTC. A sell against a long streak of rising candles, entered one candle later, after a red candle off resistance with CCI overbought. A win. At this point +41,000 ₽ for 7 trades.
- USD/BDT OTC. A 10,000 ₽ sell against four rising candles on an "endless rise" chart, that is, a breach of the strategy's own rule. Resistance is broken, a loss.
- CAD/CHF OTC. A 22,000 ₽ recovery to sell from resistance between two levels with CCI overbought, a loss. Another 48,400 ₽ from the next resistance, a loss again.
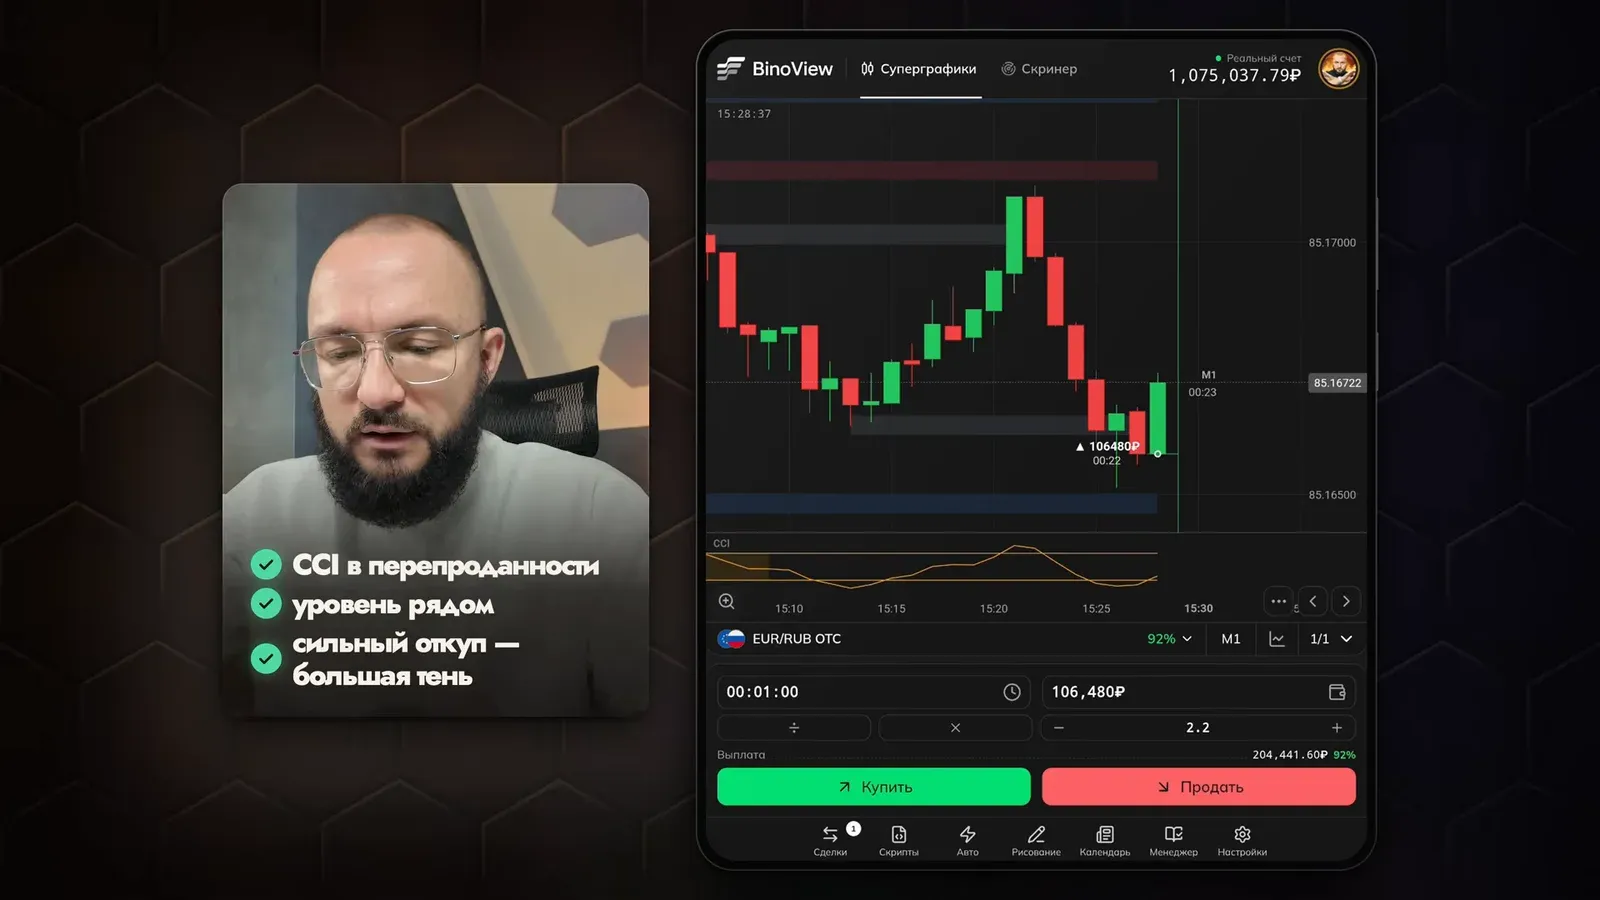
- EUR/RUB OTC. The fourth step of 106,480 ₽ to buy: CCI oversold, a level nearby, a candle with a long lower wick showing a strong buyback. A win: at a 92% payout that is 97,962 ₽, and the series closes at +17,562 ₽.
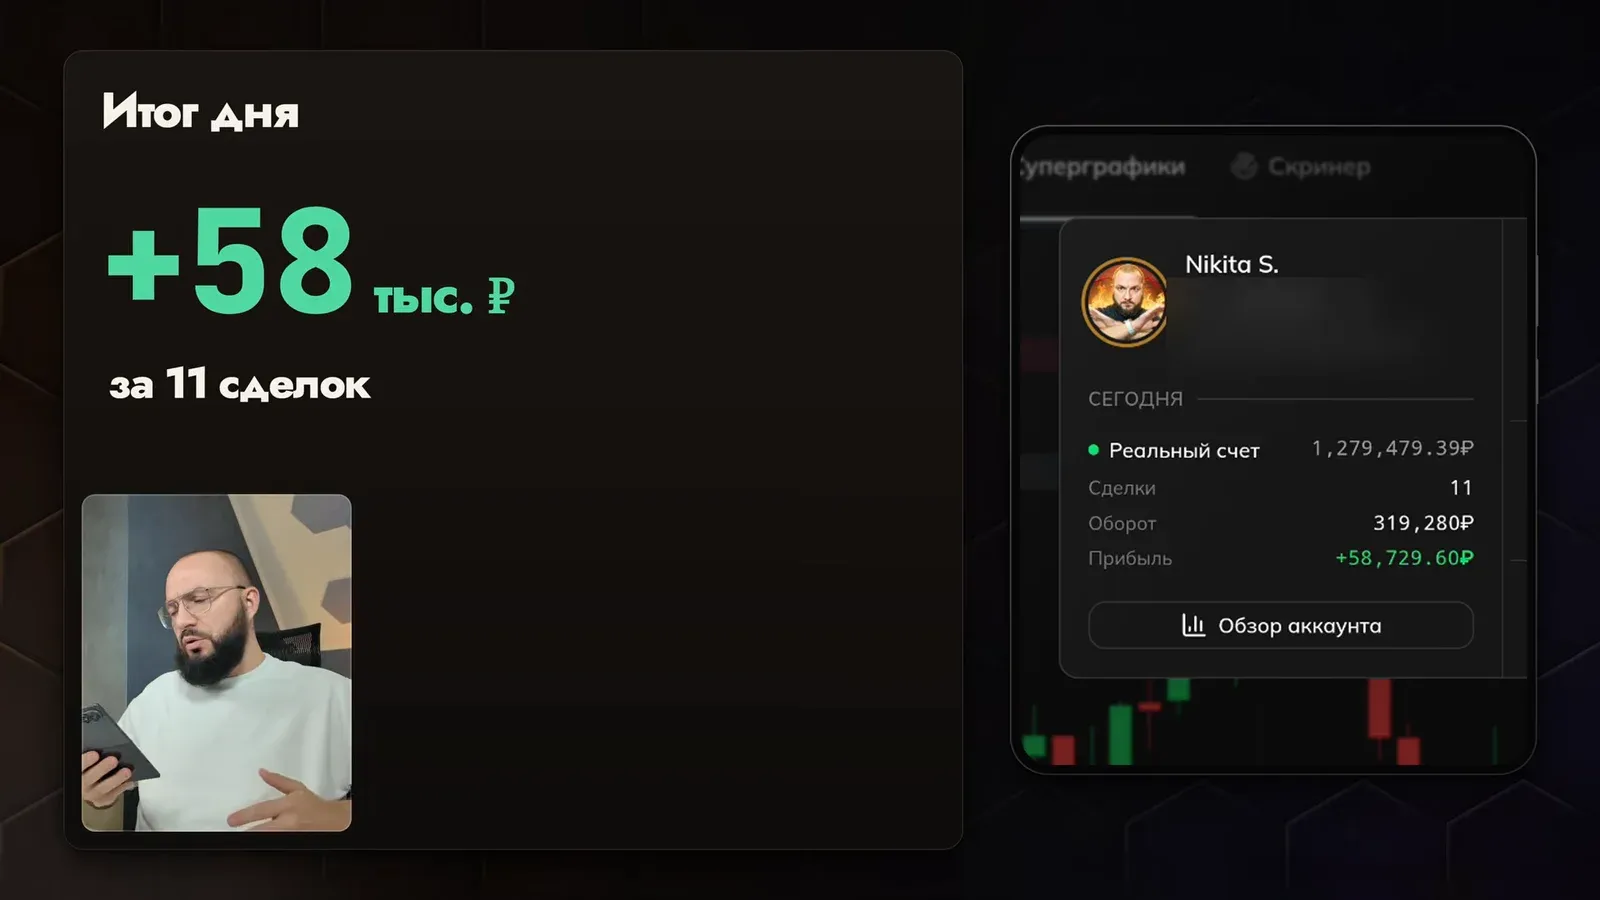
The result on screen at the end of the recording: 11 trades, 319,280 ₽ turnover, +58,729.60 ₽ profit. This is the result of the recording, not the strategy's expected return. Half of the profit was made by the fourth recovery step, which risked 106,480 ₽ after three losses in a row. Trades 6 and 7 were opened in breach of the extended-move rule, and the video honestly calls them dangerous. Which losing streak would be the last one for your deposit is calculated by the drawdown calculator, and where to stop in advance is covered in the article on the daily loss limit.
The trend-following variant
The same two indicators can be turned around: instead of waiting for a bounce off a level, enter on its breakout in the direction of the move. An upward move and a breakout of resistance is a buy; a breakout of support in a downward move is a sell. In this case CCI confirms the strength of the impulse rather than overheating. It is a separate strategy with its own statistics, and it should not be mixed with the counter-trend one in a single session.
FAQ
What do the level colours on the chart mean?
Blue is a level that has already produced a bounce; it is the main one for entries. Green is support that has formed but has not yet had a reaction. Red is the same kind of resistance without a reaction. Grey is a level price has already broken; we do not trade from it. We buy from blue and green levels below and sell from blue and red levels above.
What if price breaks the level after the entry?
Nothing on this asset. If the level has turned grey, the breakout has happened, and we do not make a second attempt here: price will go to the next level. The loss stays in the amount calculation, and the recovery is sought on another chart in a new situation. In the video this is called "a double recovery on another asset".
Does the strategy work only on OTC or on Forex too?
On both markets. In the video the trades run on OTC and on the exchange pair GBP/CAD, with the same rules. On OTC it is worth being more careful in the hours when there are few traders: it is a synthetic chart, and in such stretches it can behave unpredictably. The main condition on any market is a volatile chart with confident levels, not an extended rise without pullbacks.
Author
Nick
Runs the «Много денег» YouTube channel, editor of the Academy BinoView blog.