SuperTrend + Stochastic Strategy for Binary Options: Entering on a Pullback to the Trend Line
A two-indicator binary options strategy: SuperTrend sets the direction and draws a dynamic level, the Stochastic shows overbought and oversold. Entry rules on an approach to the SuperTrend line, acceptable pokes through it and skips, the settings from the video (ATR 10, multiplier 3.7, Stochastic 14, 3, 3 with 70 and 30 zones), the trade manager with martingale from $150 and a breakdown of a session on S15: 11 trades and +$1,054.
 Nick 8 min read
Contents
A two-indicator strategy the channel's author used to trade and has come back to: SuperTrend sets the direction and draws a dynamic level, the Stochastic shows where the move is overheated. The entry is on a pullback to the SuperTrend line when the oscillator is in the opposite zone. Below are the idea, the settings from the screen, the rules table, what counts as an acceptable poke through the line and a breakdown of a real-account session: seven trades and +$760 in the first ten minutes of the recording.
The idea of the strategy
The two indicators share the work. SuperTrend paints its line green in an upward move and red in a downward one, and the line itself works as a dynamic level: in an uptrend it is support under price, in a downtrend resistance above it. The Stochastic shows overbought and oversold and says when the pullback to the line has run out of steam.
We look not for a trend reversal but for a pullback from its line. Price in an upward move corrects down, reaches the green SuperTrend line, the Stochastic is in the oversold zone at that moment and starts crossing up. That is a buy. In a downward move it is the mirror image: an approach to the red line from below, the Stochastic overbought, a sell. Reversals are not guessed by eye; the oscillator shows them.
Situations where both indicators point the same way do not qualify: a downward SuperTrend with the Stochastic oversold is a continuation of the fall, not an entry.
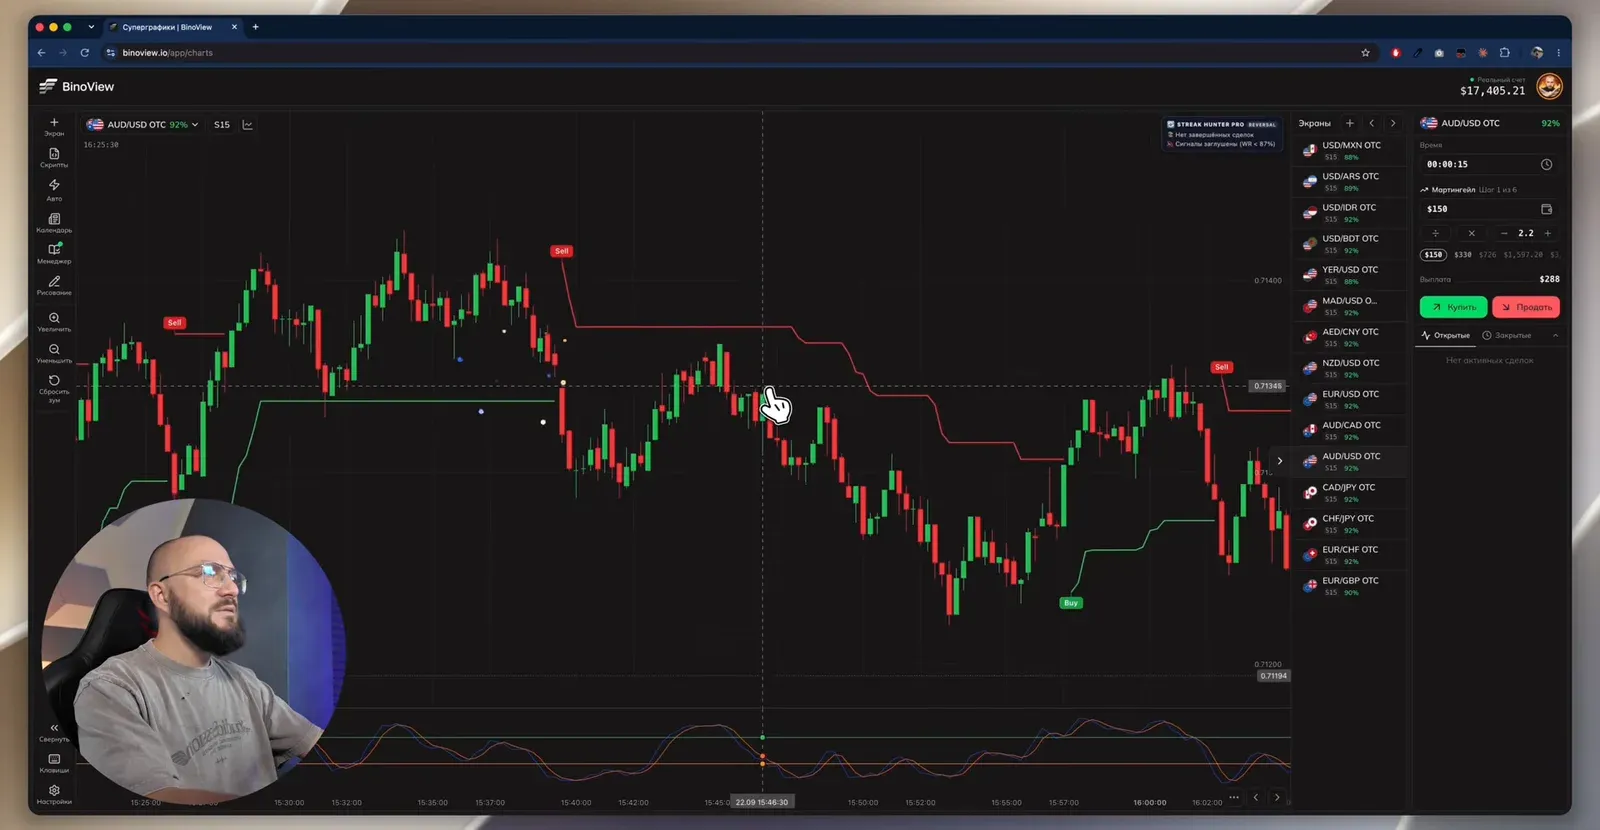
SuperTrend and other tools — in BinoView Supercharts
Settings
| Parameter | Value from the video |
|---|---|
| Timeframe | S15 in the recording, M1 and higher recommended |
| Expiration | one candle: 15 seconds on S15, a minute on M1 |
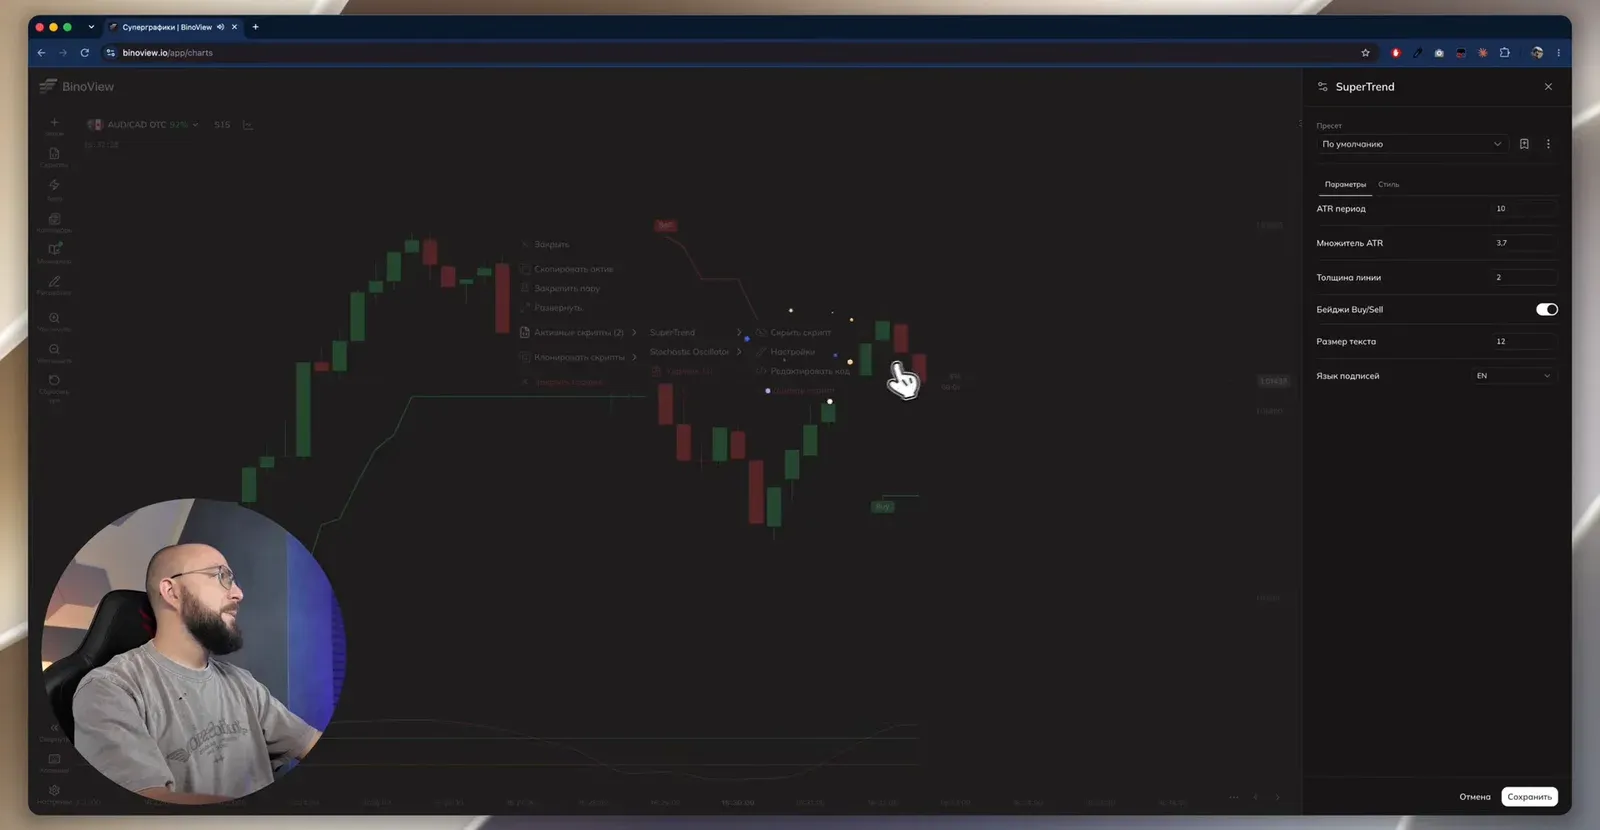
| SuperTrend | ATR period 10, multiplier 3.7, line thickness 2, Buy/Sell badges on |
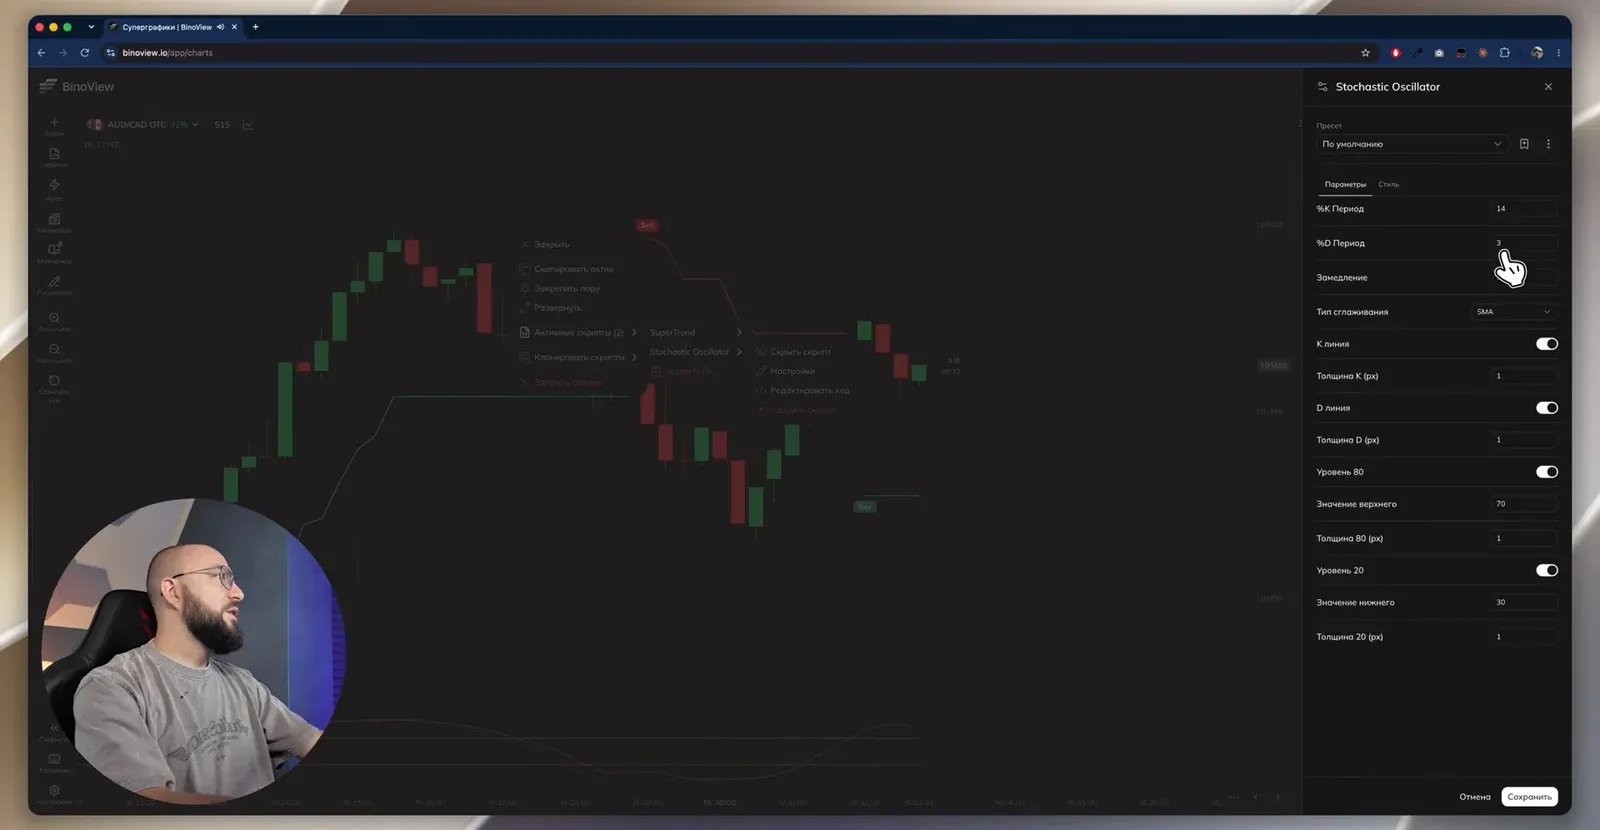
| Stochastic Oscillator | %K 14, %D 3, slowing 3, SMA smoothing |
| Stochastic zones | upper band 70, lower 30 instead of the standard 80 and 20 |
| Trade manager | martingale, first trade $150, multiplier 2.2, 6 steps, 12% target |
| Required balance | $14,047.49 for a six-step series |
| Recovery | no more than one per asset, preferably on another asset |
The 70 and 30 bands are the only thing changed in the Stochastic: the signal arrives a candle earlier than with 80 and 20. The other parameters are defaults.
Entry rules
| Situation | Trade | Condition |
|---|---|---|
| green SuperTrend, price pulled back to the line from above on a correction | buy at the open of the next candle | the Stochastic oversold, the lines crossing up or starting to converge |
| red SuperTrend, price rose to the line | sell at the open of the next candle | the Stochastic overbought, a cross down |
| a touch of the line without a breakout | the same trade, the best variant | confirmation on the next candle |
| a small poke through the line, the body returned | the same trade, the borderline variant | acceptable even if the Buy/Sell badge has already appeared |
| a confident breakout of the line, price moved on | skip | that is a new move, not a pullback |
| the signal passed, the candle has already gone | entry on the second candle or a skip | do not chase the move |
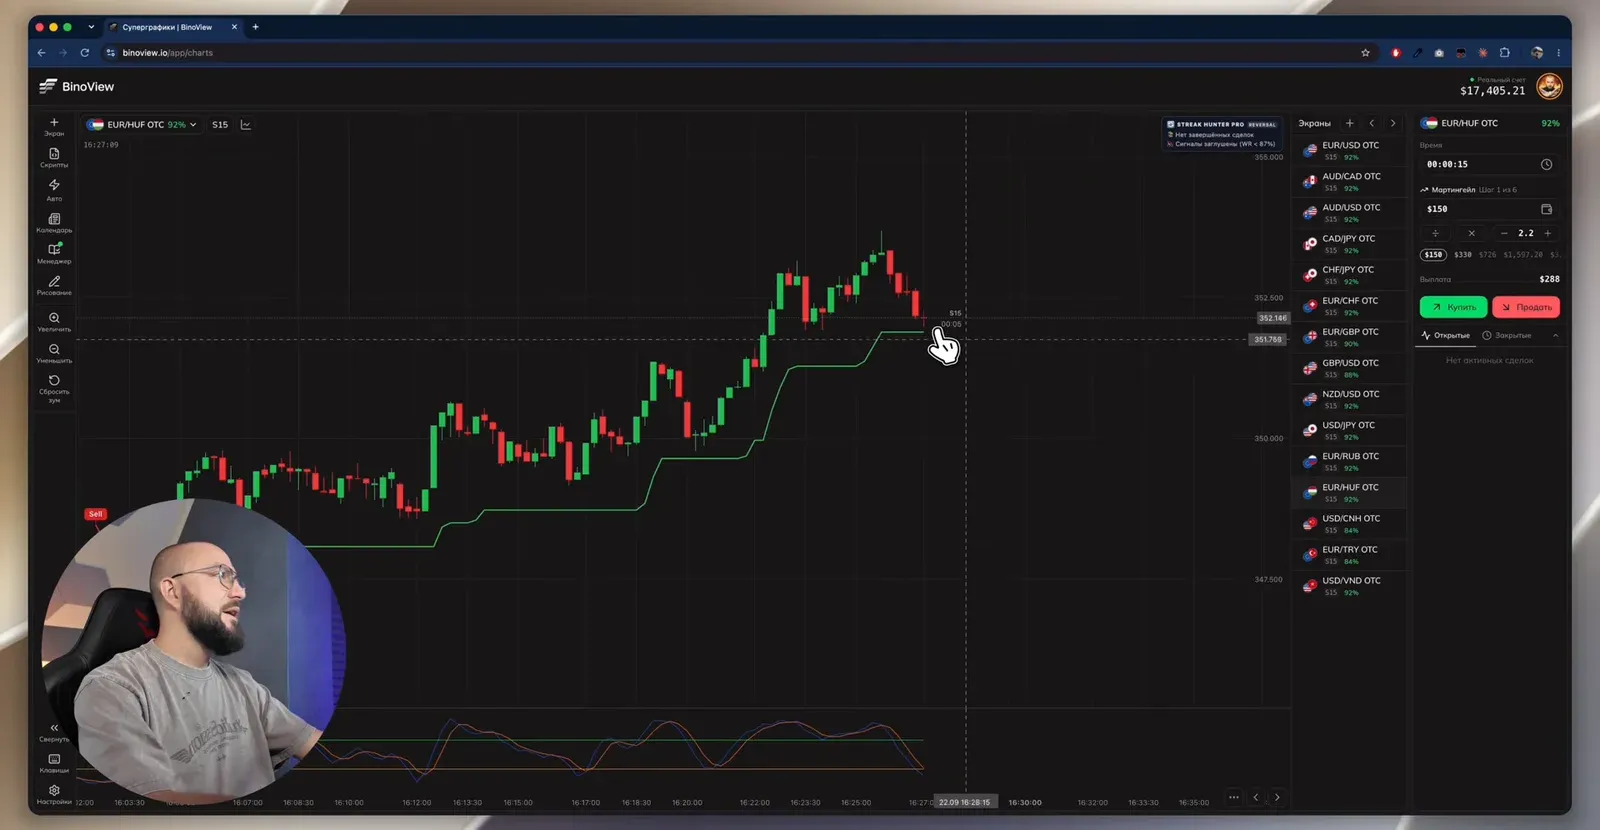
About the Buy/Sell badge: when price pokes slightly beyond the line, SuperTrend changes colour and draws a label. If the candle body returns at once, it is a "break" of the indicator, not of the level, and the entry is still possible. If the level is broken confidently, the strategy stays silent.
The trade manager and recoveries
The session opens in the trade manager: the "Martingale" strategy, first trade $150, multiplier 2.2, six steps, a 90% payout for the calculation. The manager fills in the amount of the next trade itself and writes every trade into the trader's journal; the trader only has to watch the chart. The step table on screen: $150, $330, $726, $1,597.20, $3,513.84 and $7,730.45, required balance $14,047.49.
The recovery rule from the video: no more than one recovery per asset, and preferably on another asset altogether in a different situation. A recovery on the same chart easily lands in an extended move, and that is always a risk. If there is a loss and no new situation, the trade stays a loss: chasing "on emotion" to punish the market is explicitly forbidden in the video, because it is the market that will do the punishing.
Breakdown of the session from the video
- A sell at the red line with the Stochastic crossing down, but a late entry. A loss, a recovery on the next candle from the same situation is a win.
- EUR/HUF, a buy on a correction to the green line with a cross out of the lower zone. A loss, no recovery taken: the situation is gone.
- A buy on the approach to SuperTrend with the Stochastic oversold. A win, and a second trade in the same place after the cross is a win too.
- A buy after a touch of the line in an upward move, a Buy badge. A loss, then a $330 recovery against the author's own rule about the amount is a win.
At this point the journal shows 7 trades, +$760.02, a 57% win rate, 4 wins and 3 losses in the first ten minutes. Then the video adds two more examples: a buy with a gap at the candle open and a recovery after a poke through the line, then a sell at the level in overbought with a recovery. Both were recovered with a win. The result of the recording: 11 trades, +$1,054.02, a 55% win rate, 6 wins and 5 losses.
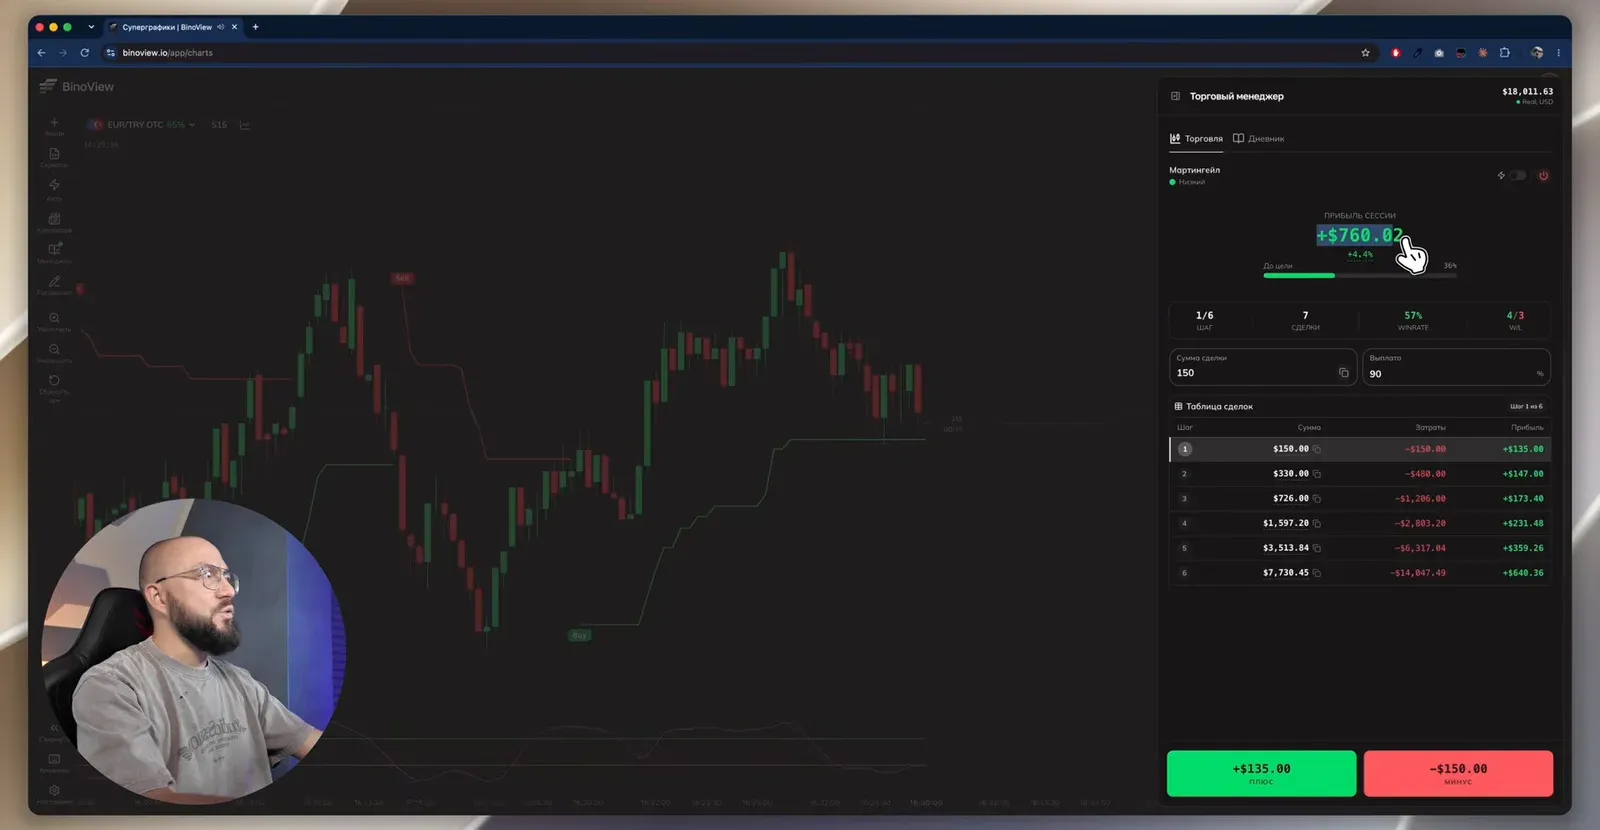
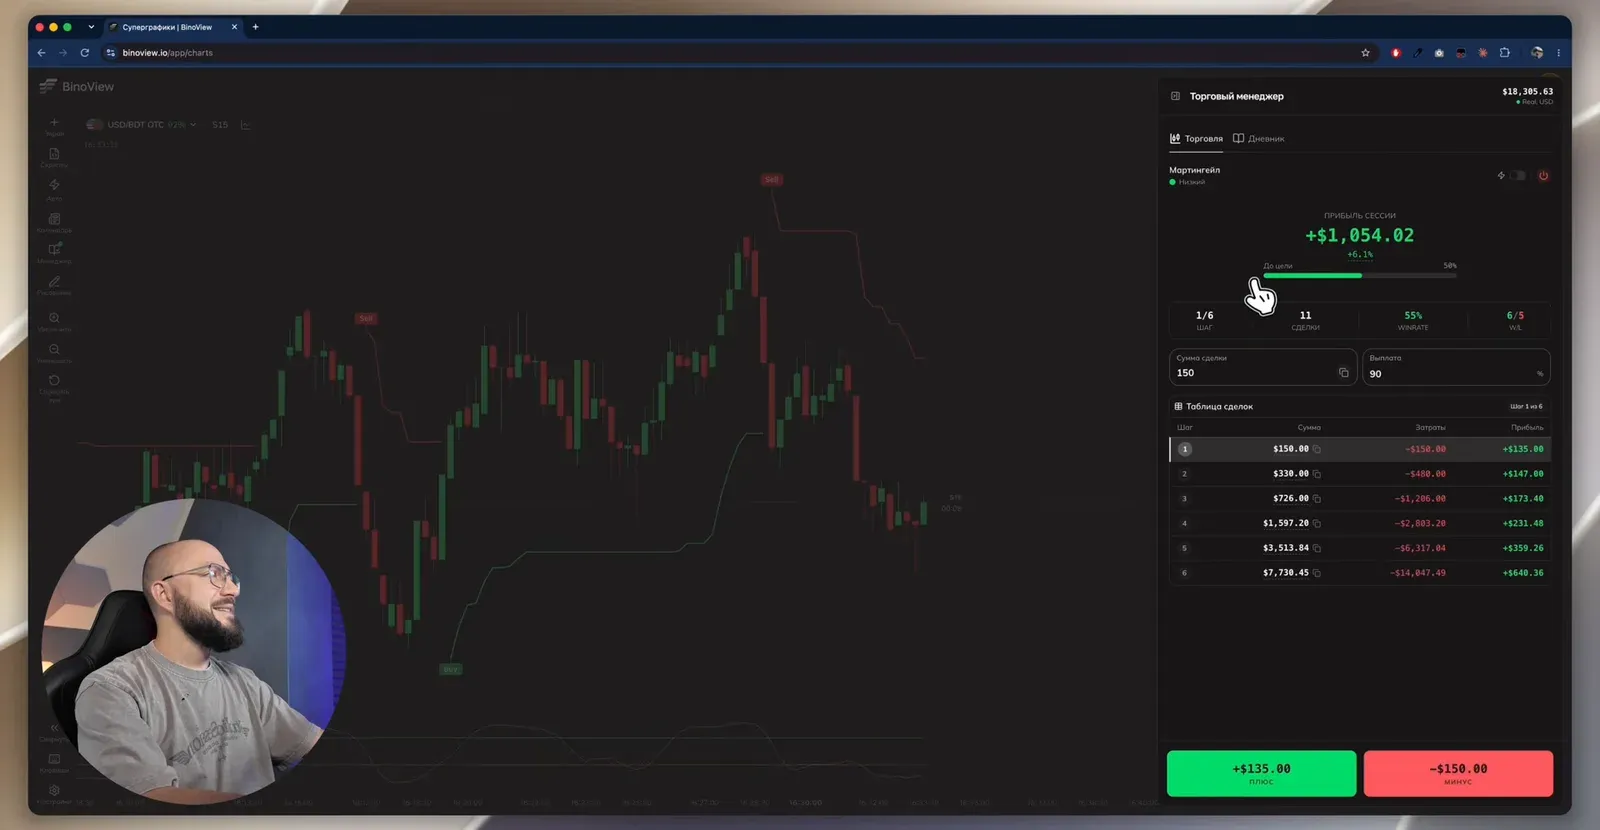
This is the result of the recording, not the expected return. Almost half of the trades closed as losses, and the profit came from recoveries at coefficient 2.2 on a $150 base. What such a series costs at your bankroll is shown by the martingale calculator, and how many losses in a row to expect at a 55% win rate is calculated by the drawdown calculator. The rule from the video that matters more than the settings: made a little, get out. The longer the session, the higher the chance of landing in a dangerous situation.
FAQ
Why is the timeframe in the video S15 if M1 is recommended?
The 15-second candles were chosen for the sake of the recording: on S15 situations appear every few minutes, and the video fits into ten minutes. On M1 the same five to seven trades would take hours to wait for. For trading without haste the video recommends M1 and higher: there is less noise and fewer false Stochastic crossovers.
Can I enter if SuperTrend has already changed colour?
Yes, if the colour change has only just happened and the candle body has returned behind the line: the indicator has "broken", but the real level has not. Such a situation is considered borderline but acceptable. If price has confidently broken the line and moved on, the entry is skipped: that is a new move, not a pullback.
How many recoveries to take after a loss?
One per asset, and preferably on another asset altogether on a new signal. A recovery on the same chart risks getting into an extended move where the reversal comes later than the bank runs out. In the video, after a loss on EUR/HUF the trade is left without a recovery: the situation is gone, so we look for the next one.
Author
Nick
Runs the «Много денег» YouTube channel, editor of the Academy BinoView blog.