Levels and DeMarker 1-Minute Strategy: Entry Rules for OTC and Forex
A counter-trend binary options strategy on two indicators: automatic support and resistance levels (Average Support & Resistance) and the DeMarker oscillator with 0.7 and 0.3 zones. Level colours, buy and sell rules on M1, which charts to skip, a single recovery after a loss and a breakdown of an OTC session: 18 trades and +$1,595.94 for the day.
 Nick 9 min read
Contents
The basic manual trading combination most traders start with: support and resistance levels plus one oscillator. Two indicators, one rule and no noise on the chart. The same idea with the CCI oscillator is covered in the levels + CCI strategy from a smartphone. Here DeMarker takes the place of CCI, and trading runs from a computer across 15 screens through the trade manager. Below: how DeMarker differs from CCI, the settings from the screen, the rules table, which charts to skip and a breakdown of an OTC session: six trades on camera and +$1,595.94 for the day according to the journal.
The idea of the strategy
The strategy is counter-trend: we wait for price to reach a support or resistance level while DeMarker is in an extreme zone at that moment. Then we open a trade for one corrective candle against the move. The goal is to catch a correction or a reversal from the level, not a continuation of the trend.
There are two conditions, and both are needed. Price at resistance but DeMarker in the middle of its channel — no match, skip the chart. DeMarker overbought but no level nearby — skip as well: there is no telling where the move will stop.
The expiration is one minute on a 1-minute chart, with entry at the open of a new candle.
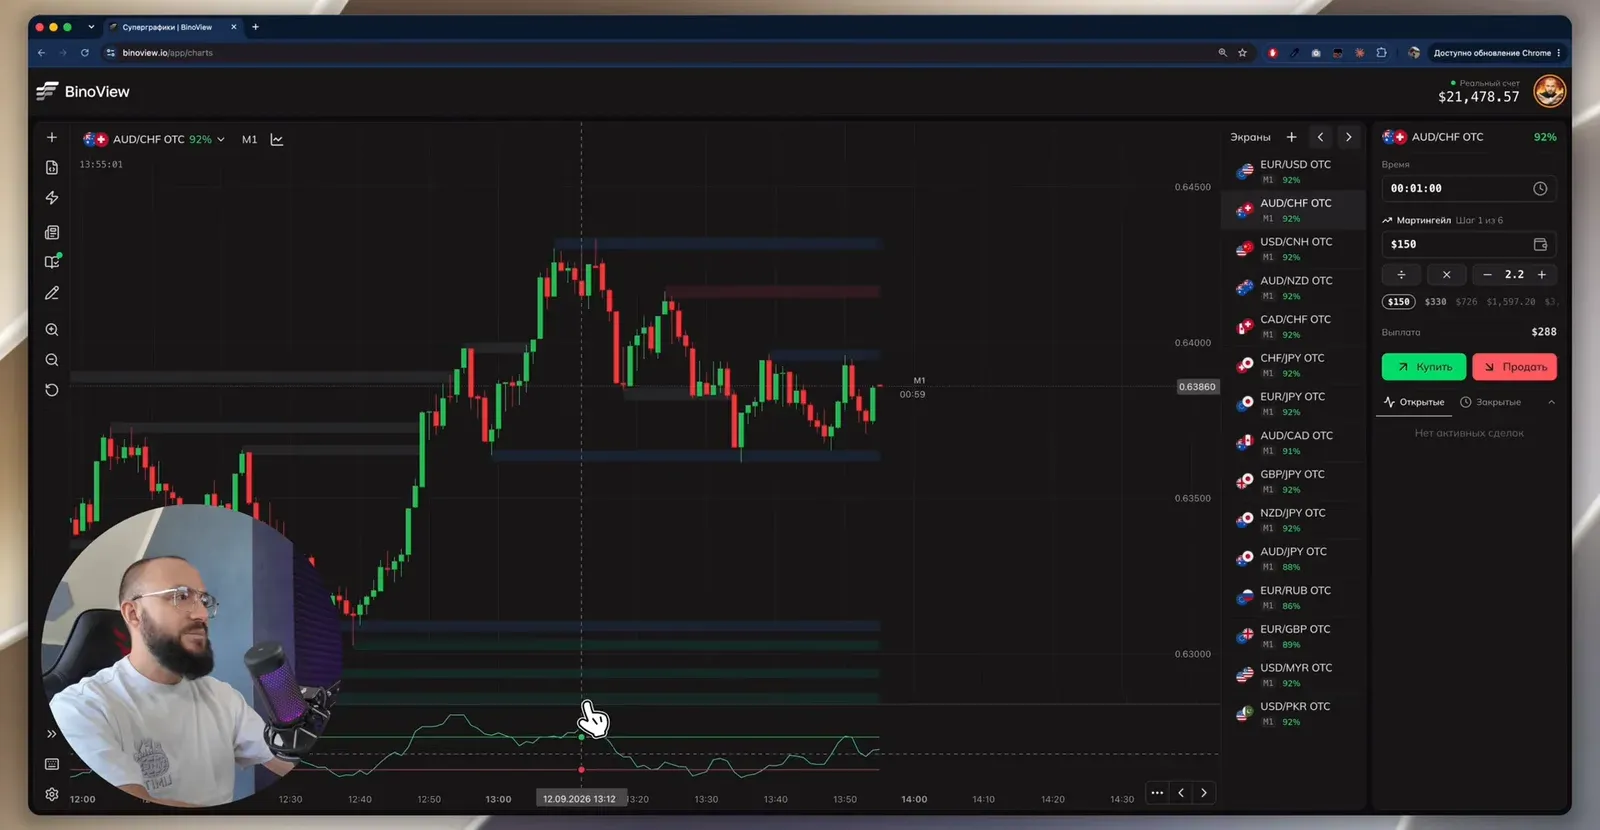
Levels: what the colours mean
The levels are drawn by Average Support & Resistance, so nothing needs to be drawn by hand. Exact prices are not needed either: it is enough to see the nearest zone above and below.
| Colour | What it is | How we use it |
|---|---|---|
| blue | a level that has already produced a reaction | below price it is support, above price it is resistance |
| green | support that has not had a reaction yet | buy on approach |
| red | resistance that has not had a reaction yet | sell on approach |
| grey | a broken level | no trades, but it can become a mirror level |
Colours change as trading goes on. Red resistance that a candle bounced off and closed below turns blue: the reaction has happened. The grey zone of a broken support works as resistance once price comes back to it — this is a mirror level.
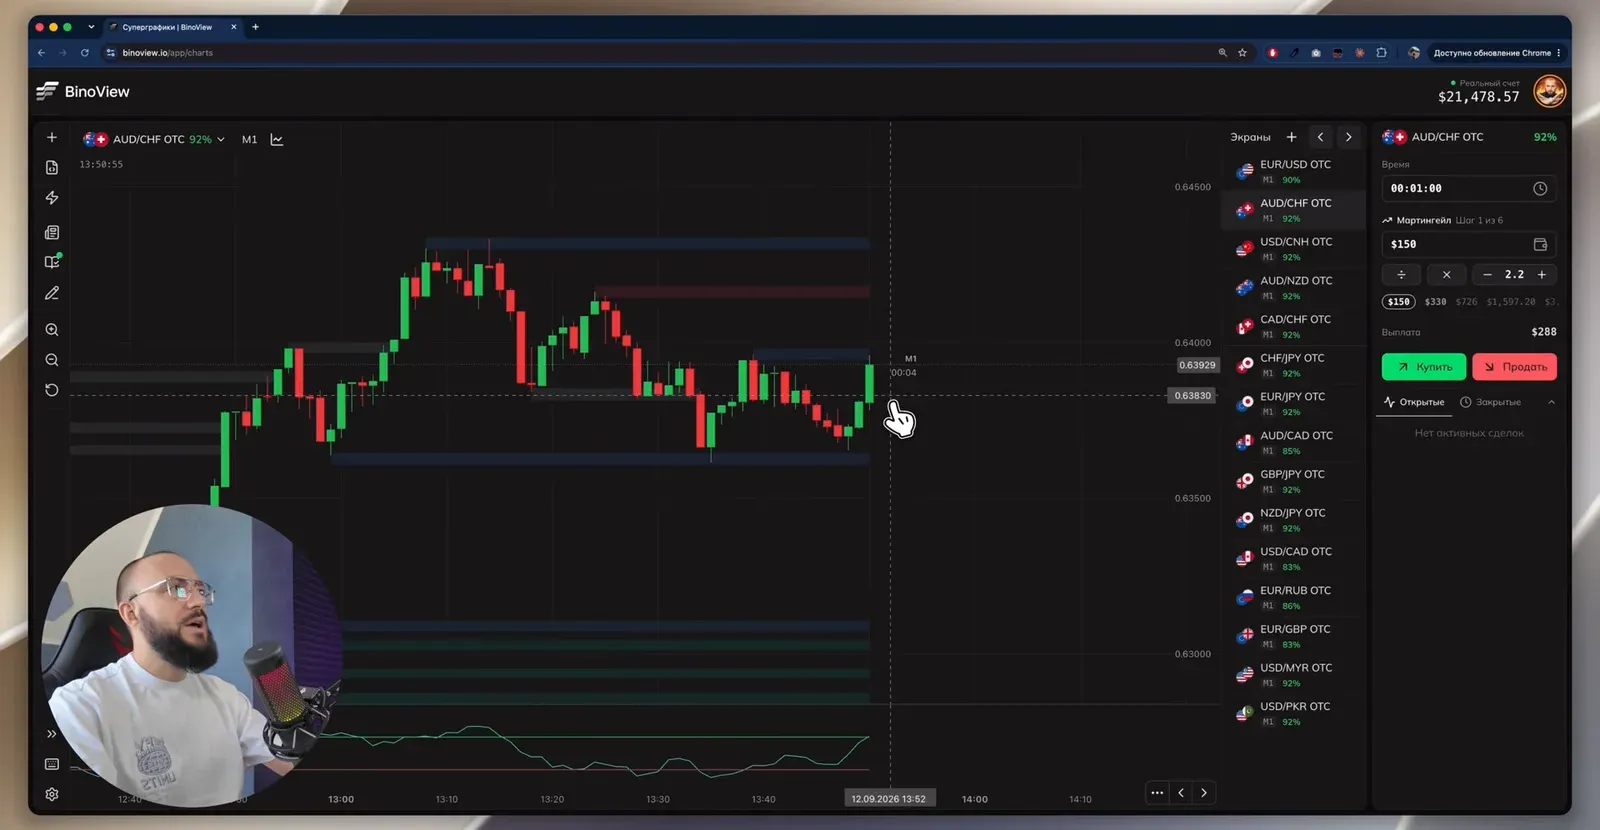
DeMarker instead of CCI
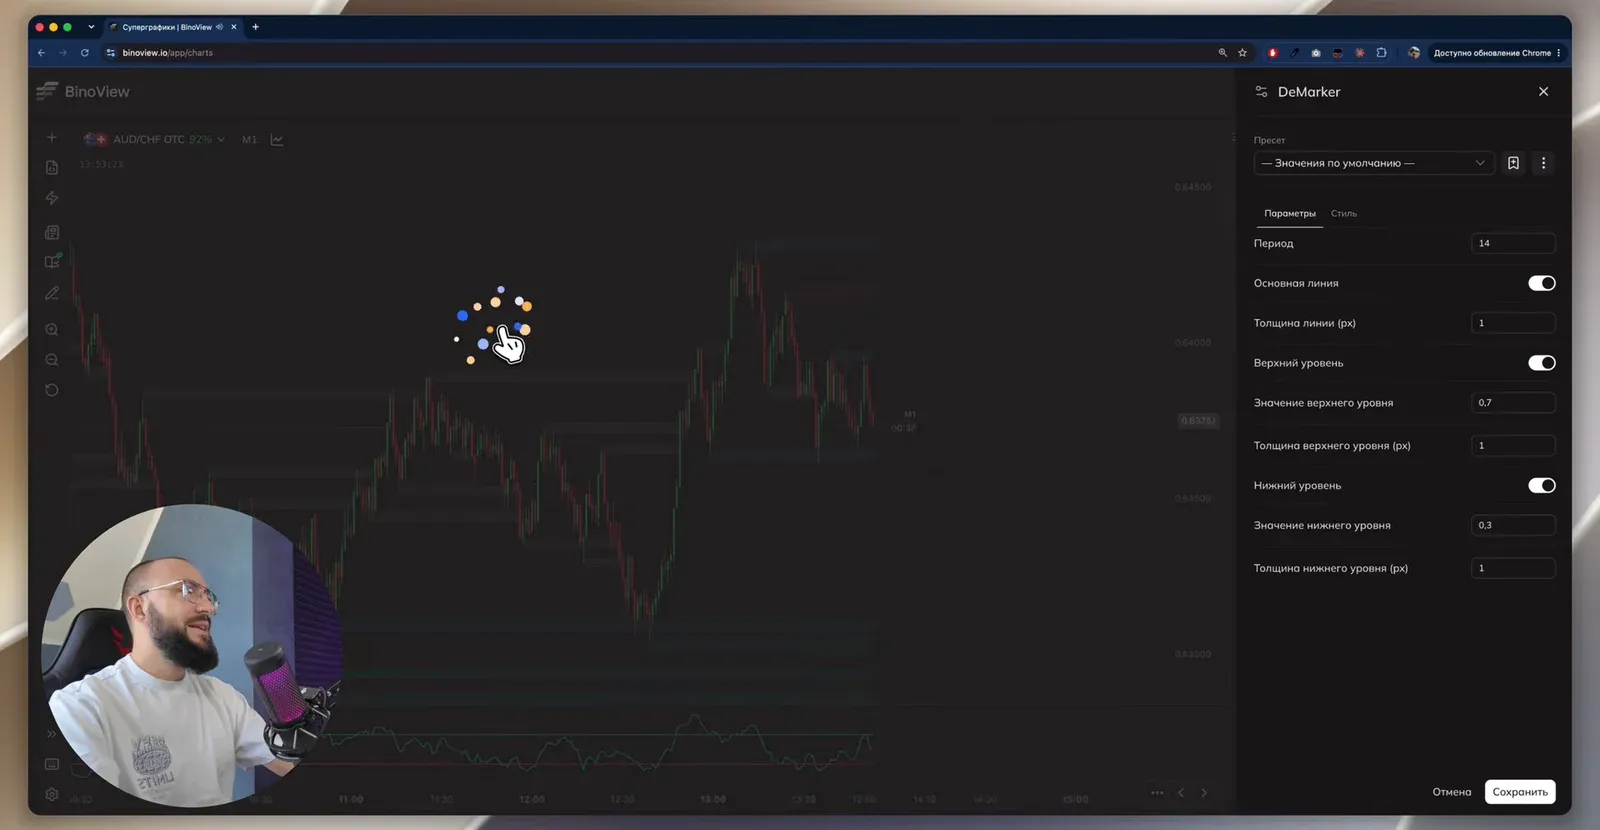
DeMarker compares each candle with the previous one: how much the high has risen and how much the low has fallen. Over 14 candles it calculates what share of the movement came from buyers, so its scale always runs from 0 to 1. A line above 0.7 (the green boundary) means overbought, below 0.3 (the red boundary) means oversold. Crossing the boundary by itself only marks a place where a reversal is possible, not certain. DeMarker is not used on its own, only together with a level.
How this strategy differs from the CCI version:
| Levels + DeMarker | Levels + CCI | |
|---|---|---|
| Oscillator scale | 0 to 1, zones 0.7 and 0.3 | unbounded, zones around +100 and −100 |
| What it measures | new highs and lows of neighbouring candles | price deviation from its average |
| Workspace | computer, 15 screens | smartphone, one chart |
| Amount and recovery | $150, one recovery on the same asset | 10,000 ₽, first recovery on the same asset, the second on another |
| Market in the recording | OTC only, Saturday | OTC and Forex |
Because its scale is bounded, DeMarker lies at the edge of the scale for a long time in an extended move, with nowhere higher to go. This is not a "strong signal" but a sign that the move is not running out of steam. The strategy skips such charts.
DeMarker and other tools — in BinoView Supercharts
Settings
| Parameter | Value from the video |
|---|---|
| Timeframe | M1, M15 to check levels |
| Expiration | 1 minute, entry at the open of a new candle |
| DeMarker | period 14, line width 1 px, upper level 0.7, lower 0.3 — the defaults |
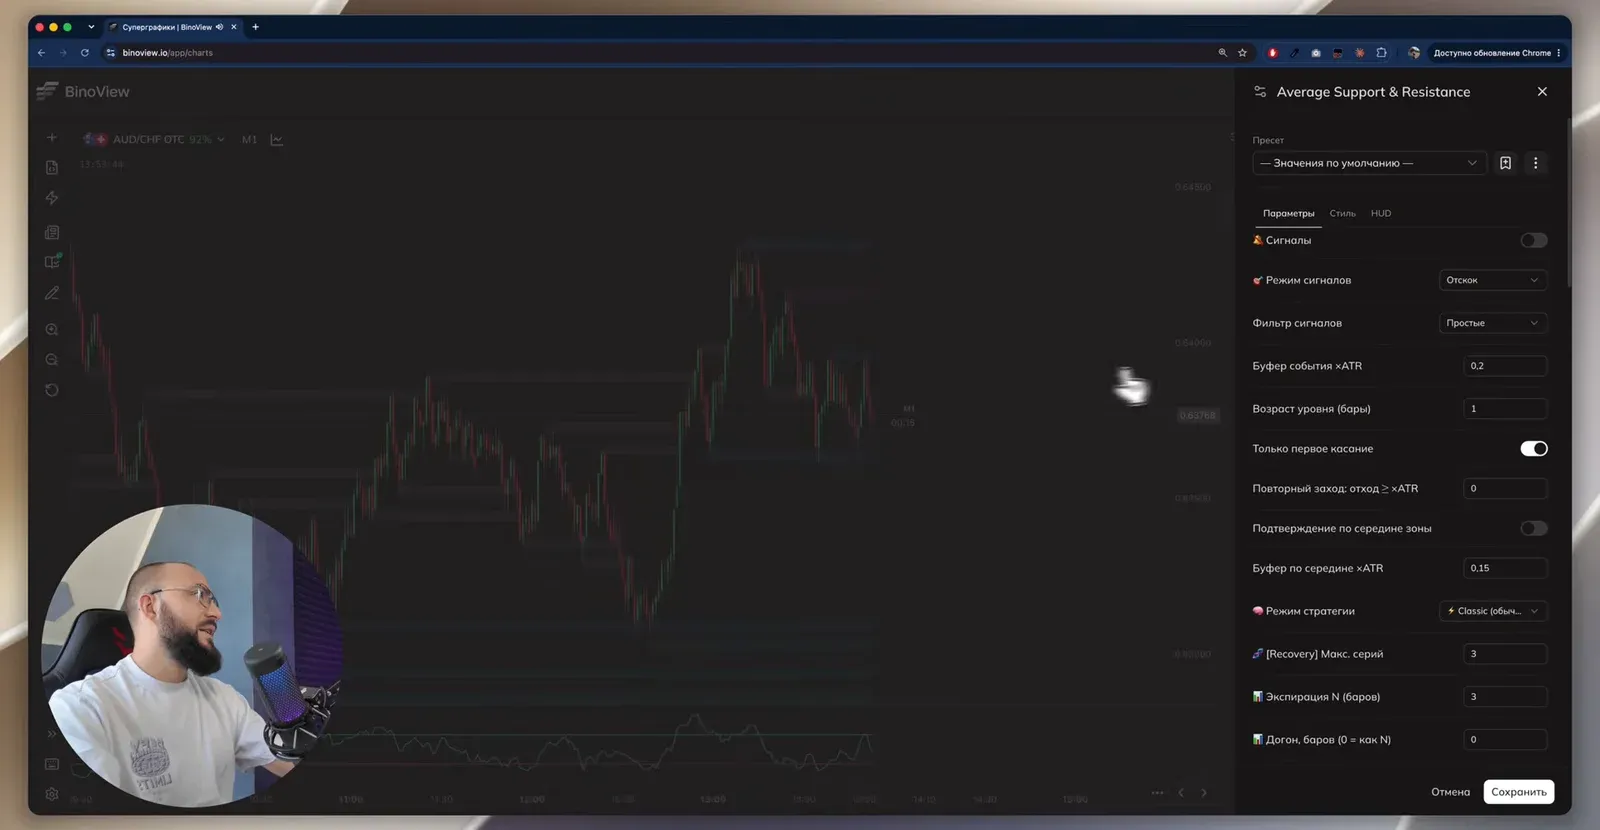
| Average Support & Resistance | "Default values" preset, the indicator's own signals are off |
| Screens | 15 OTC assets, switched with the up and down arrow keys |
| Payout | 92% on most assets, 83% on EUR/RUB OTC |
| Trade amount | $150 with a balance of about $21,500 — below 1% of the deposit ($213) |
| Trade manager | "Martingale" strategy, 6 steps, multiplier 2.2 |
| Recovery | one, on the same asset |
Screens are added with the "+" button on the "Screens" panel. Put both indicators on every screen; then all that is left is to switch assets with the arrow keys and look for a level coinciding with a DeMarker zone.
Entry rules
| Situation | Trade | Condition |
|---|---|---|
| price at resistance (blue above price or red), DeMarker on the 0.7 line or above | sell from the open of the next candle | the level is not broken |
| price at support (blue below price or green), DeMarker on the 0.3 line or below | buy from the open of the next candle | the level holds |
| price has returned to a broken support from below, DeMarker above 0.7 | sell from the mirror level | the breakout was an impulse candle |
| the first trade closed as a loss, the level holds | one recovery in the same direction | no second recovery |
| DeMarker in the middle of the channel | skip | even if price is at a level |
| the level is broken, DeMarker in an extreme zone | skip | price is heading to the next level |
An extra sign is a long wick at the level. The longer the upper wick at resistance, the harder buyers and sellers are fighting: sellers are already pulling price down. An entry inside an active candle is worse than one at the open: if the candle has already moved away from its open, the next one may turn sharply against the trade.
Which charts to skip
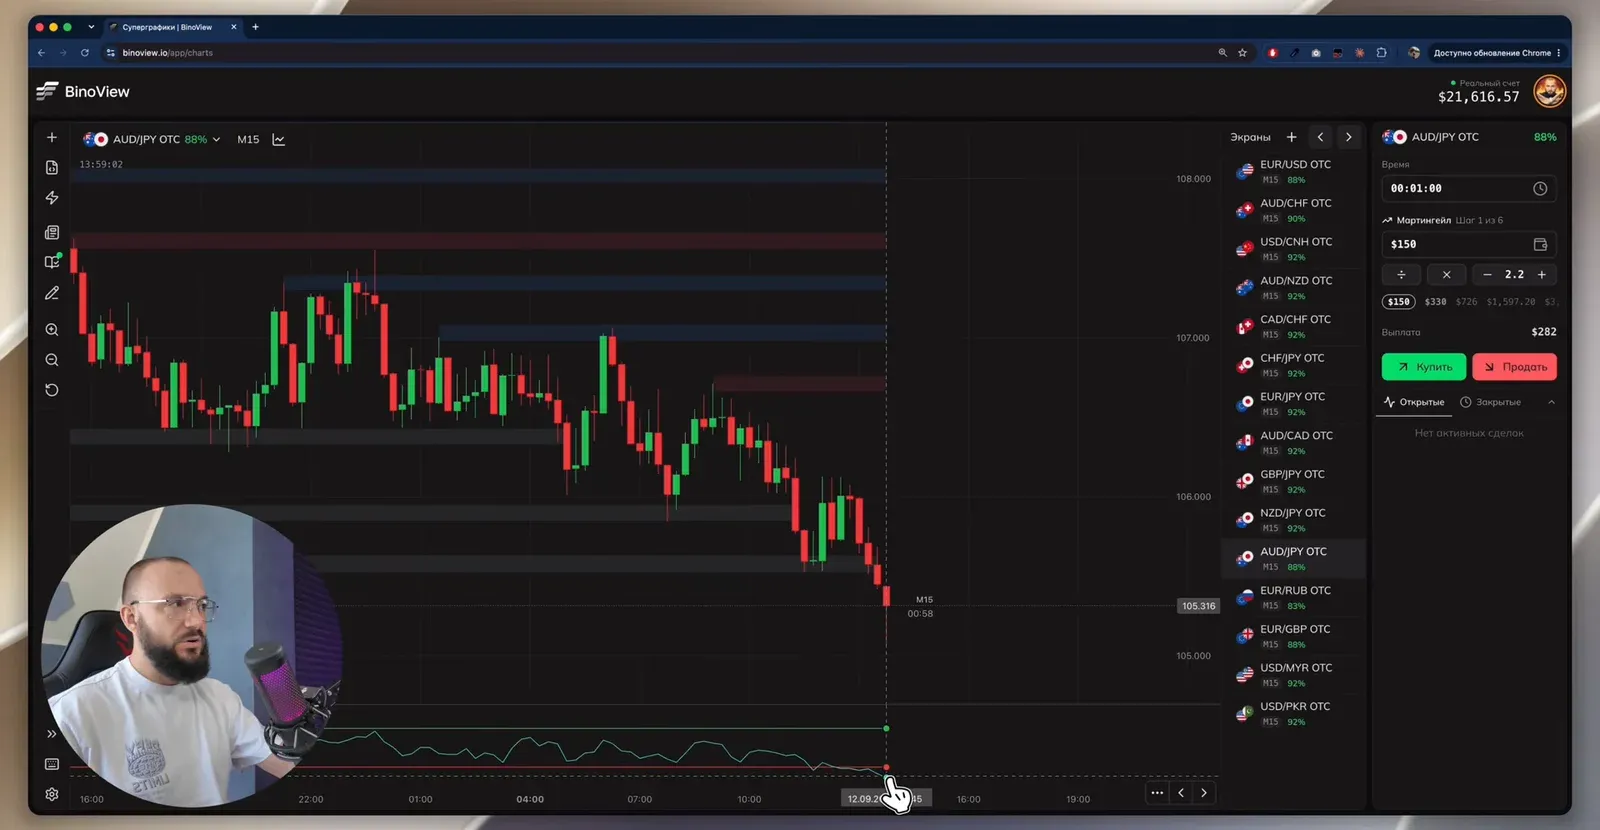
The main risk of the strategy is an extended trend. When DeMarker is already deep in oversold, it is tempting to buy "the reversal". But if there is not a single level below price over the last thousand 1-minute candles, there is nothing for it to stop at. Check the higher timeframe: switch to M15 and see whether there are levels there. No levels on M15 either, and DeMarker oversold there too — skip the chart. Wait for a reversal or a corrective move: price goes above the current levels and forms new ones.
Two more cases to skip:
- A breakout while overbought. Red resistance and DeMarker above 0.7 is a setup, but price broke the level and kept going. After such a breakout DeMarker can stay in the zone for as long as it likes; there is no reason to enter against the move.
- A level that has already worked. If a trade from the level has already closed, we do not enter on this chart again and look for a new situation on another screen.
Such extended moves are common on OTC: the synthetic chart often runs in one direction with high volatility and then just as sharply in the other.
Recovery: only one
The amounts are handled by the trade manager with the "Martingale" strategy: after a loss it fills in the next step itself, after a win it goes back to the first. The steps with multiplier 2.2: $150 → $330 → $726 → $1,597.20 → $3,513.84 → $7,730.45. For all six steps the manager shows a required balance of $14,047.49.
The strategy's rule is shorter than the table: after a loss, one recovery on the same asset and no more. If the second step also fails, price is breaking the level and accelerating, and going further along the progression on the same chart means chasing the trend. With one recovery a series on an asset costs no more than $480.
Keep the payout in mind. The manager calculates the steps for 92%, while EUR/RUB OTC pays 83%: a "−$150, +$330" series there gives +$123.90 instead of +$138. What a chain of steps costs at your bankroll is shown by the martingale calculator.
Breakdown of the session from the video
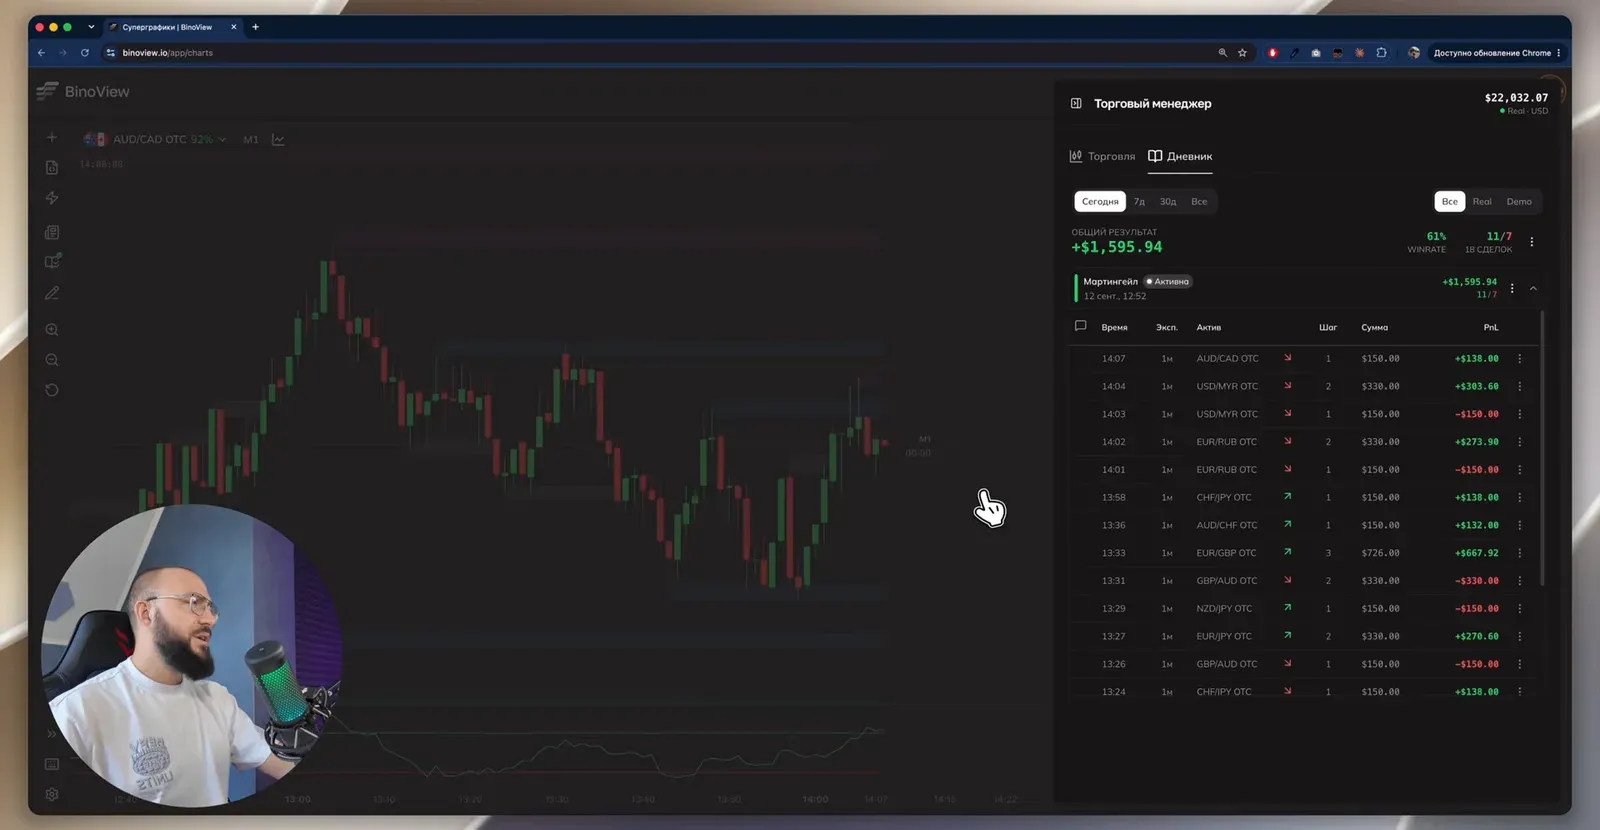
The trade manager session started at 12:52; the recording covers its last part, from 13:50 to 14:07. All trades are on OTC with a 1-minute expiration.
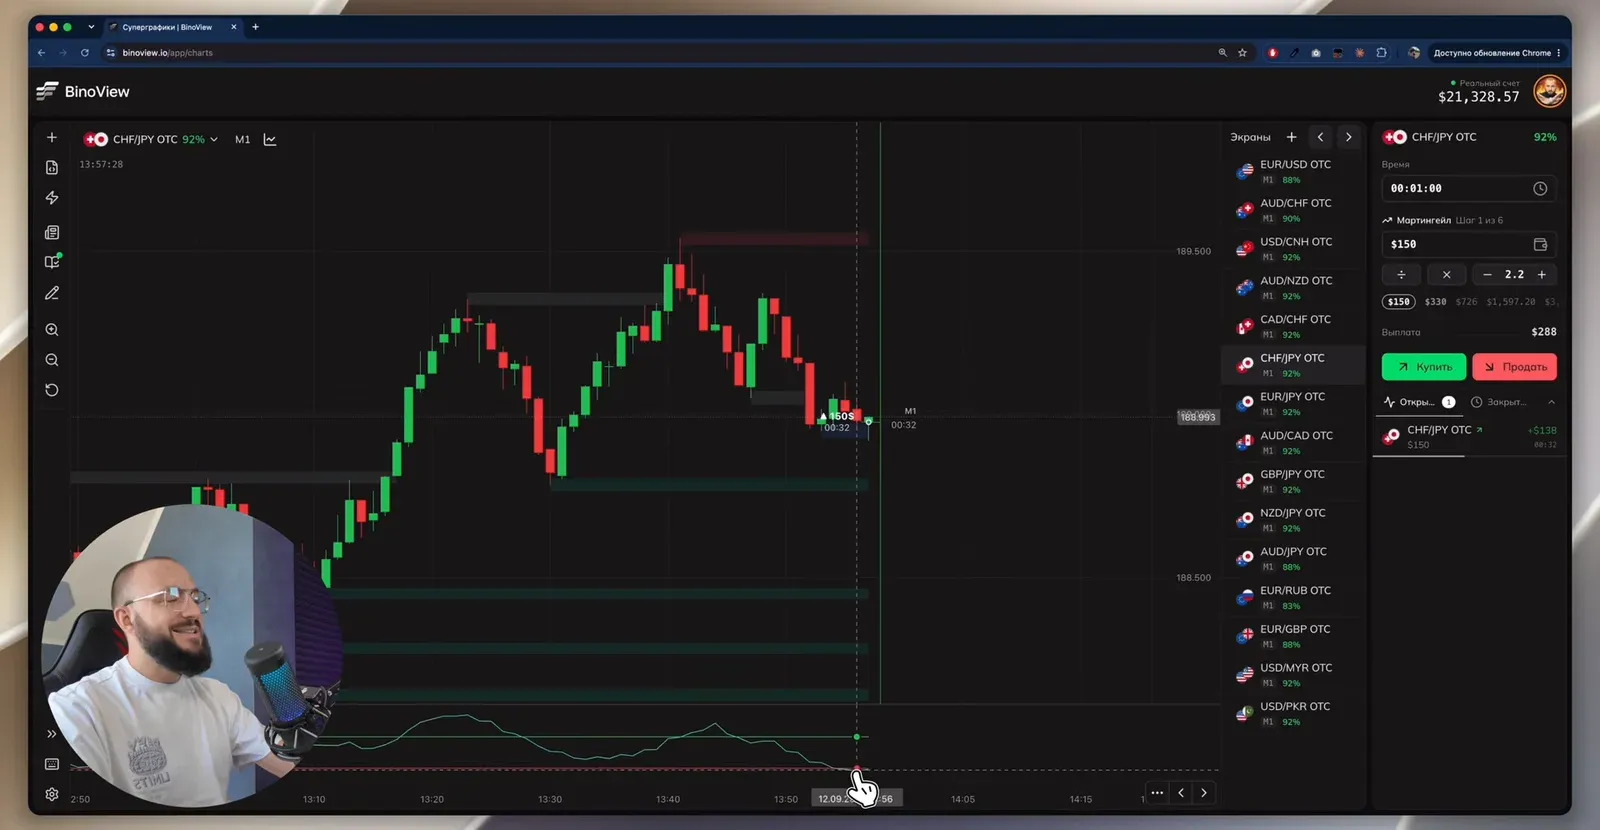
- CHF/JPY OTC, $150 buy. The nearest support is weak and local, a stronger level has formed below. DeMarker has dropped under 0.3. The risk is that a larger downward move continues, so one recovery is prepared in advance. A win, +$138.
- AUD/JPY OTC, skipped. An extended fall, no levels on either M1 or M15, DeMarker oversold on both timeframes.
- EUR/RUB OTC, $150 sell at an 83% payout. DeMarker above 0.7. An impulse candle had broken the support before, and now it works as a mirror resistance: it is not highlighted on the chart, but the old grey zone helps. DeMarker keeps rising in overbought, and the trade closes as a loss.
- EUR/RUB OTC, $330 recovery to sell. A win by literally one pip: +$273.90, the series +$123.90. After that DeMarker goes higher, and the next resistance is well above price — no entries on this asset until it is reached.
- USD/MYR OTC, $150 sell. DeMarker is overbought, but the downtrend has turned into a range: the nearest resistance is already grey, price broke above it with an impulse, came back and is drifting towards the next level. A loss.
- USD/MYR OTC, $330 recovery to sell from the next, red resistance. There is a long upper wick above the level, and the candle opened with a gap up. A win, +$303.60. The red level turned blue after the touch and pullback, and we leave this asset: the level has done its job.
- AUD/CAD OTC, $150 sell. Price is at resistance, DeMarker has moved above 0.7, the candles have long wicks on both sides — a struggle is under way. The entry is not at the candle open but late, which breaks the rule. A win, +$138.
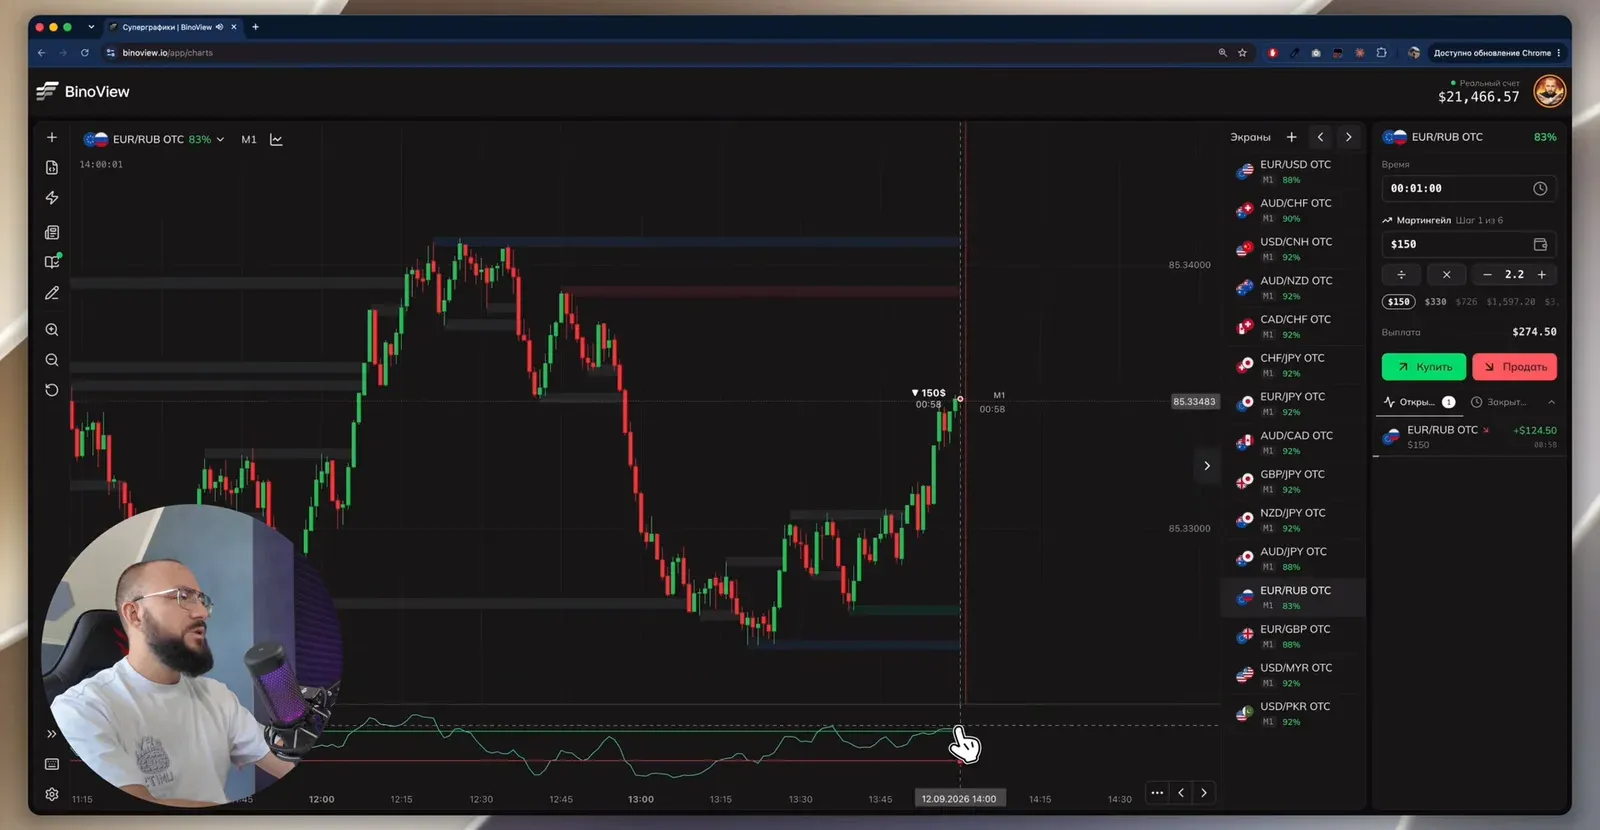
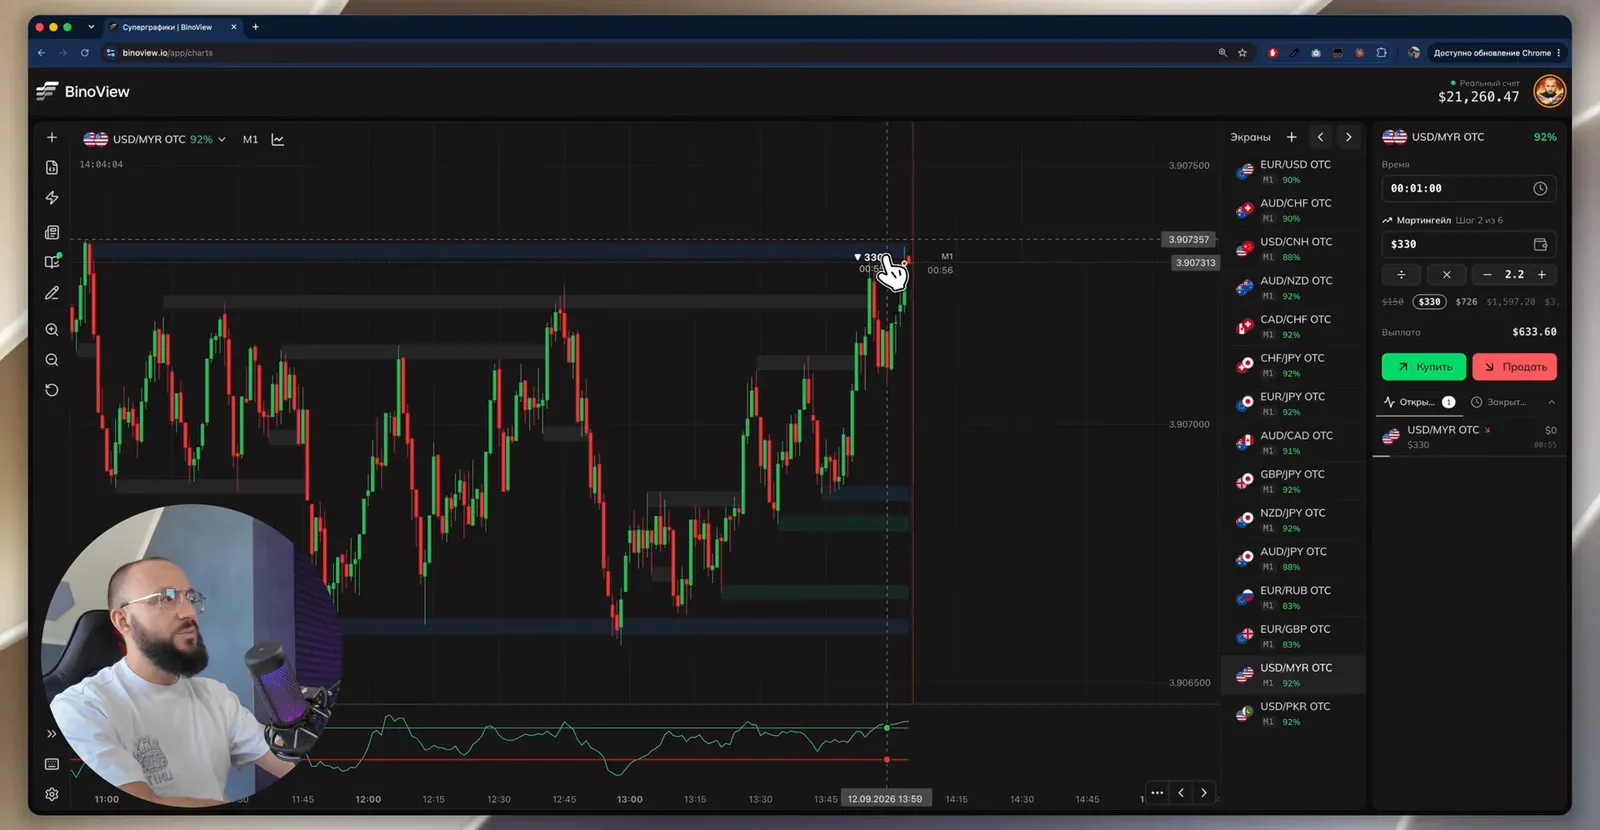
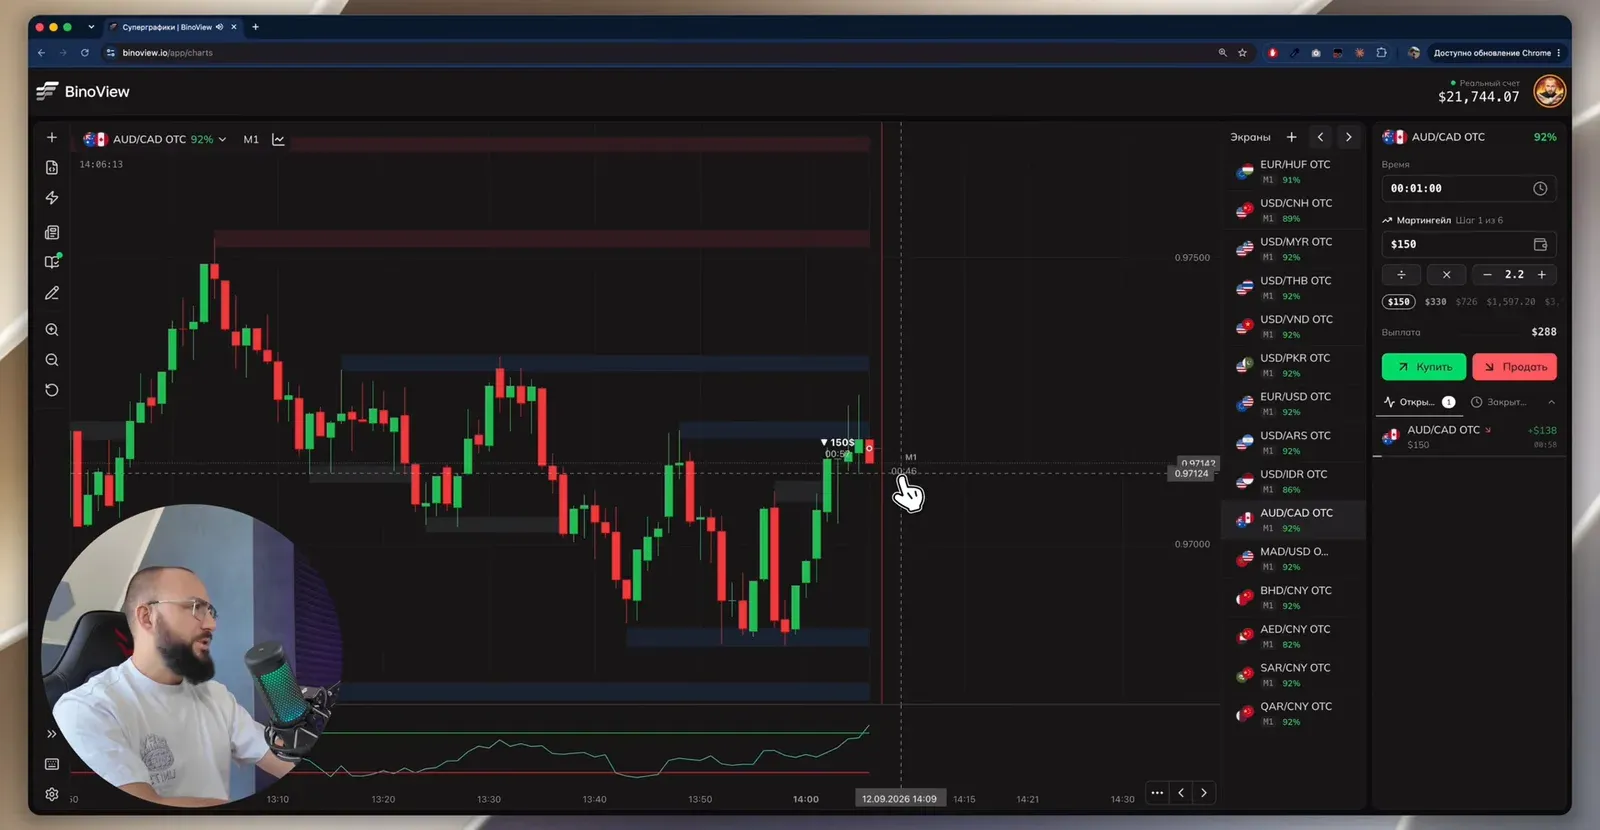
On camera there are six trades: four wins and two losses, with the balance rising from $21,478.57 to $22,032.07, that is +$553.50. In the middle of the recording the closed trades tab showed +$1,304.34 for the day's 15 trades. The trade manager's result at the end: 18 trades, 11 wins and 7 losses, a 61% win rate, session profit +$1,595.94 (+7.8%). According to the journal one series went to the third step: after losses on NZD/JPY OTC ($150) and GBP/AUD OTC ($330), a $726 step on EUR/GBP OTC closed with a +$667.92 win.
This is the result of the recording, not the strategy's expected return. At a 92% payout the breakeven win rate is about 52%. A 61% margin over 18 trades can easily disappear in one bad streak. Your own statistics for the strategy should be gathered over dozens of sessions, not one.
FAQ
How does DeMarker differ from CCI in a levels strategy?
Both oscillators show overbought and oversold conditions, but DeMarker compares the highs and lows of neighbouring candles and always stays on a scale from 0 to 1. That is why its zones are fixed at 0.7 and 0.3, and in a strong move the line sticks to the edge of the scale for a long time. CCI has no bounds and measures how far price deviates from its average. The entry rule is the same in both strategies: a level plus the extreme zone of the oscillator.
How many recoveries should I take after a loss?
One, on the same asset. If it also closes as a loss, leave that chart: most likely the level is breaking and price is accelerating. The trade manager in the recording is set to six martingale steps with a 2.2 multiplier, but the one-recovery rule keeps the series short: $150 and $330, so no more than $480 per asset.
Why is the strategy shown on OTC, and does it work on Forex?
The video was recorded on a Saturday, when Forex is closed, so every trade in the recording is on OTC. The rules are the same for both markets. OTC more often moves in sharp one-way bursts with high volatility, so extended moves, against which a counter-trend entry is dangerous, occur there more often. Weekends on OTC, especially on a demo account, are a convenient training ground before trading Forex on weekdays.
Author
Nick
Runs the «Много денег» YouTube channel, editor of the Academy BinoView blog.