BinoView Terminal User Guide: Every Button and What It Does
A step-by-step reference to the BinoView trading terminal for Pocket Option and BinoDex: the header and account statistics, the chart menu and script cloning, the trade panel, the catalog and your own scripts, every auto trading setting with the risk calculation, bot history and statistics, terminal settings, hotkeys, display modes and the screener.
 Nick 13 min read
Contents
This is a reference, not a feature tour: no strategies here, only where each button is and what it does. We follow the same order as the video, top to bottom and left to right, from the header and the chart to auto trading, the settings and the screener. If you are new to the platform, start with the BinoView review from A to Z and come back here when you need a specific setting. The video has a timestamp for every feature in its YouTube description.
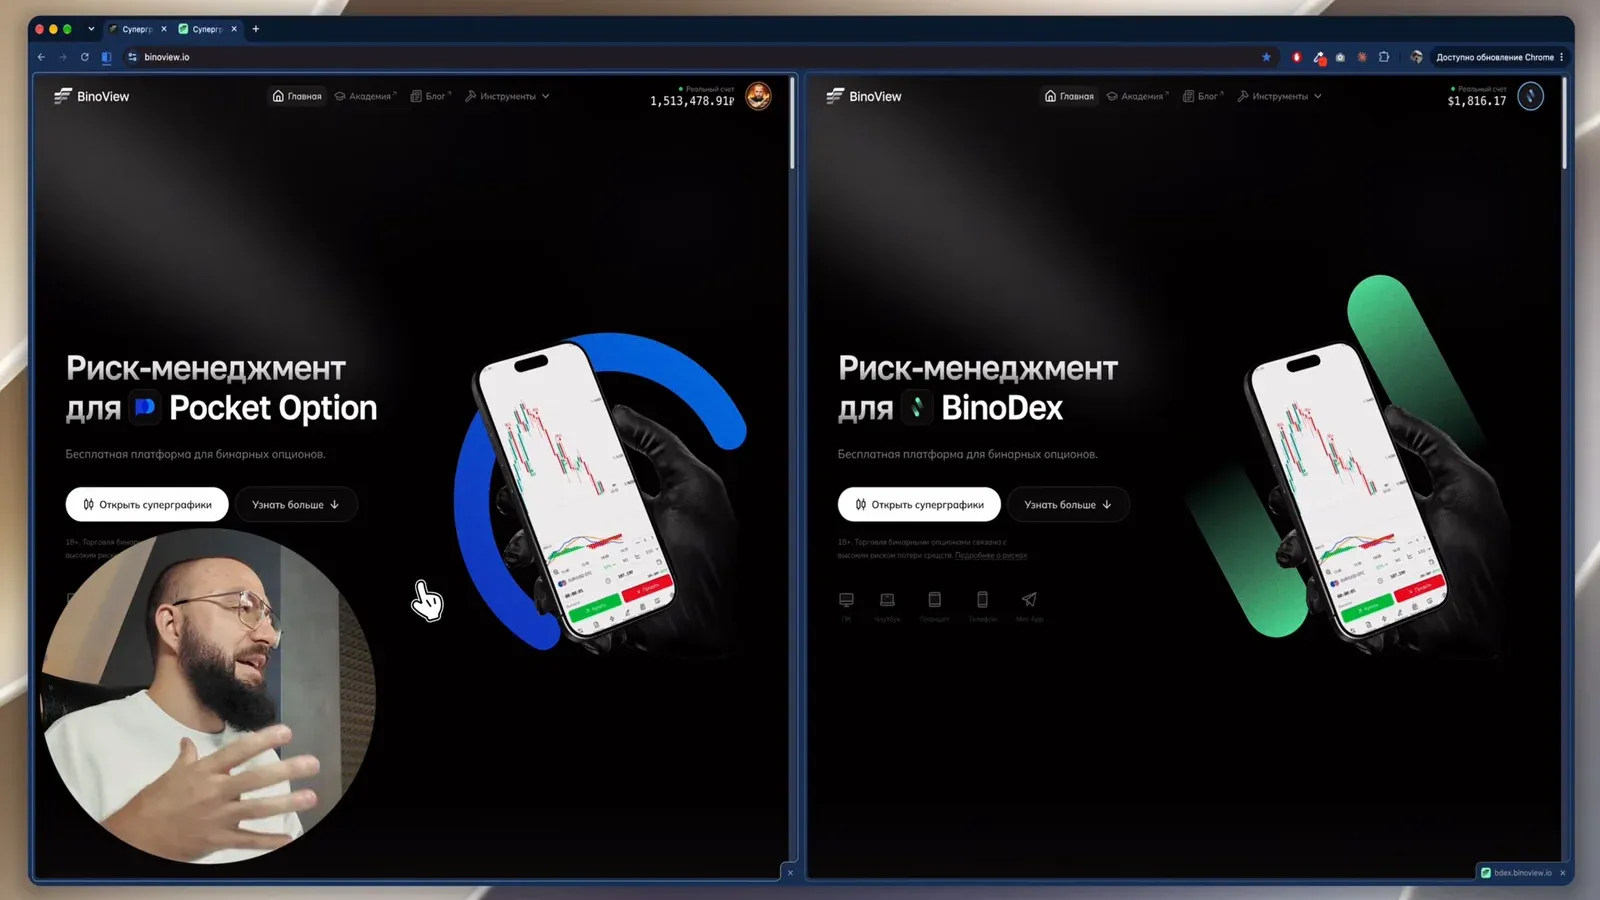
Two addresses: Pocket Option and BinoDex
The terminals differ by the broker logo on the home page: blue for Pocket Option, green for BinoDex. Inside, Supercharts are identical, so everything below is shown on Pocket Option and carries over to BinoDex unchanged. The broker itself is covered in the BinoDex review.
Header: account, profile and statistics
At the top there are two tabs: Supercharts and Screener. The logo takes you to the home page.
- Balance switches between the real and the demo account. On the real account it has "Deposit" and "Withdraw" buttons next to it. How to fund Pocket Option without P2P is covered in a separate guide.
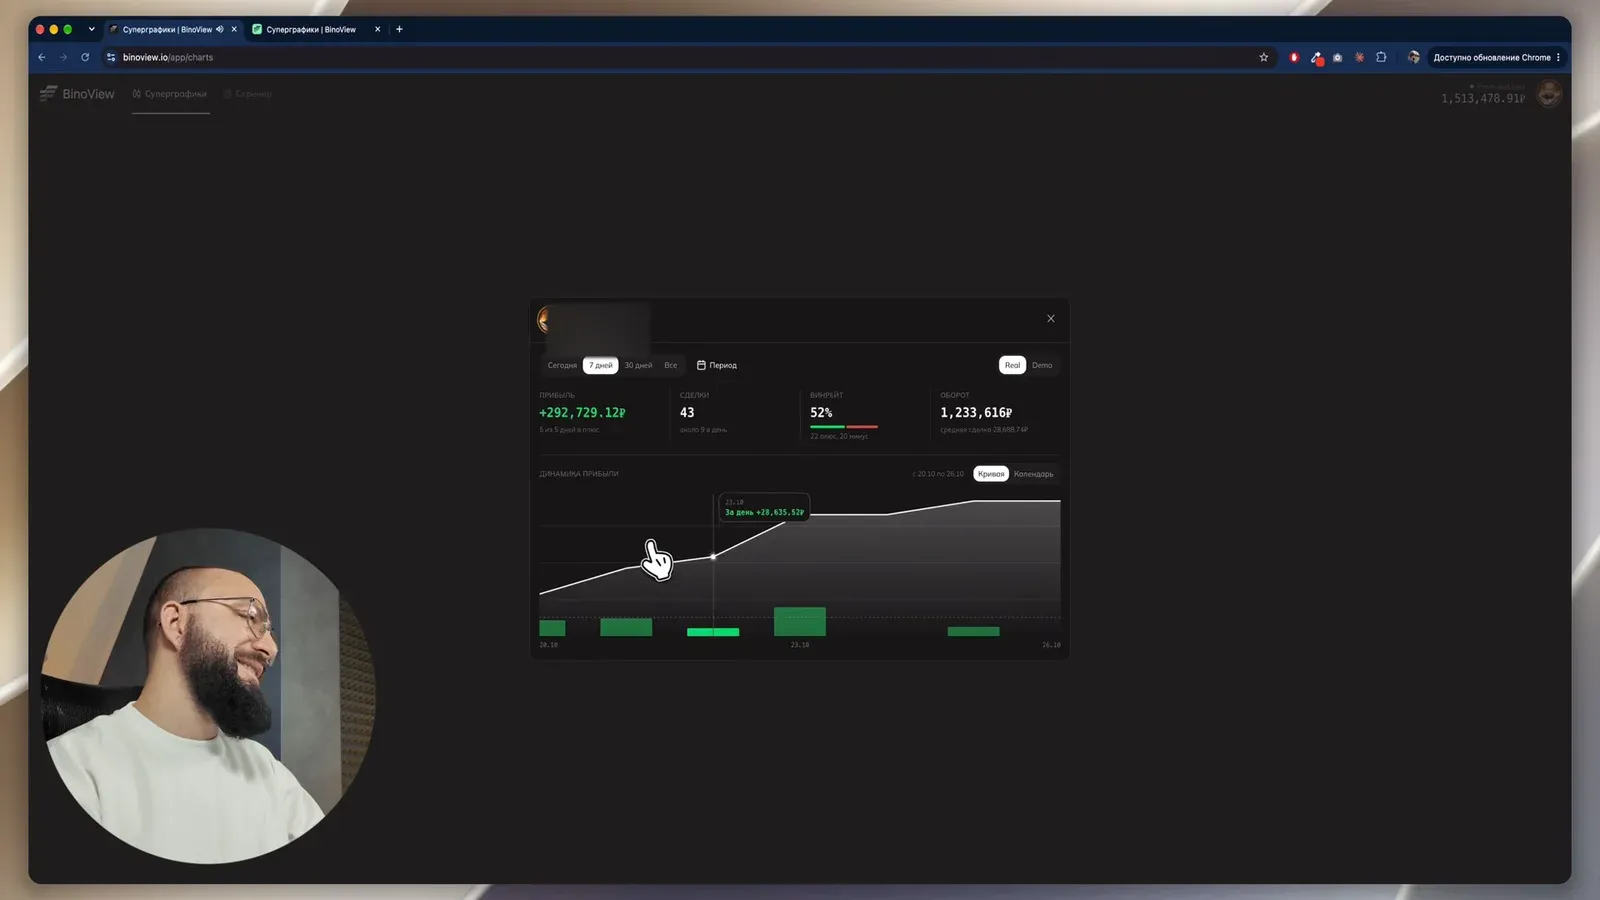
- Avatar opens the profile: account type, balance, today's trades, turnover and profit.
- Account overview in the profile shows statistics for today, 7 days, 30 days, all time or a custom period: profit, number of trades, win rate, turnover and a daily curve. Real and demo are switched in the corner of the window.
- Academy and Blog open the trading academy, which is shared by partners of both brokers.
- Tools switches between Supercharts and the Screener, followed by language (Russian or English), theme (dark, light or system) and log out.
Left menu
Almost everything in the terminal starts from the narrow menu on the left. A short map, with details below:
| Button | What it does |
|---|---|
| Screen | adds a new chart, up to 15 in total |
| Scripts | catalog of indicators and bots, favorites, your own scripts |
| Auto | launching and managing auto trading |
| Calendar | economic calendar |
| Manager | trade manager and trading journal |
| Drawing | lines and shapes on the chart |
| Zoom in, zoom out, reset zoom | chart scale |
| Back, forward | switching pairs on the charts |
| Keys | the list of hotkeys |
| Settings | market, terminal look and sounds |
Chart: asset, scripts and menu
Work starts with the "New screen" button. At the top left of the chart we pick the category and the asset, the market type (real or OTC), a timeframe from seconds to minutes and the candle type: Japanese candlesticks or Heiken Ashi. Next to it is the indicators button with the popular standard indicators and a couple of custom ones. With several screens open, the move button swaps them around.
A right click on the chart opens a menu:
- Copy asset and paste it onto another screen.
- Pin pair: during mass switching it stays put while the others change.
- Expand the chart to full screen and collapse it back.
- Active scripts: what is turned on for this chart. Here a script can be hidden, its settings opened (parameters, style, card, signals), and for your own scripts the code editor.
- Clone scripts from another chart onto this one, or from this one onto all charts at once. Everything is copied: indicators, tools, bots.
The three dots on the asset card set the market type and the minimum payout for that chart only: for example, keep only the real market on it and OTC on the rest. If you have scrolled back through the chart history, the button in the lower right corner brings it back to the current candle.
Trade panel
On the right is a classic panel:
- Time by timer (a fixed trade duration) or by flag (the trade closes at a chosen time). For the flag you can turn on a time auto-shift and set its value.
- Amount is entered manually or as a percentage of the deposit: tap the wallet icon and pick, say, 1%.
- Multiplier buttons under the amount divide and multiply it by a coefficient, handy for manual martingale. They are enabled in the terminal settings.
- Buy and Sell, with open trades and closed trade history below.
BinoView Supercharts — free for partners
Scripts: catalog, favorites and your own
Scripts are all the indicators and bots in the terminal. The window has tabs:
- Catalog: vetted scripts, split into bot and indicator tabs. "Add to chart" puts a script on the chart and saves it to favorites right away.
- Favorites: other people's scripts you have added. They can be sorted into folders such as "Experiments" and "Verified".
- My scripts: everything you have created, also with folders. Each script has a version history showing what changed and when.
- On chart: everything currently turned on across the charts.
The search at the top finds a script by name, author or number. "Create script" opens the editor: "For AI" copies a link to the reference for a neural network (you do not need to read it, the AI does), with buttons to copy, paste and undo changes next to it. After pasting the code, click "Save script" and it works on the chart immediately. How to write a script with a neural network is covered in the article on creating bots in the terminal.
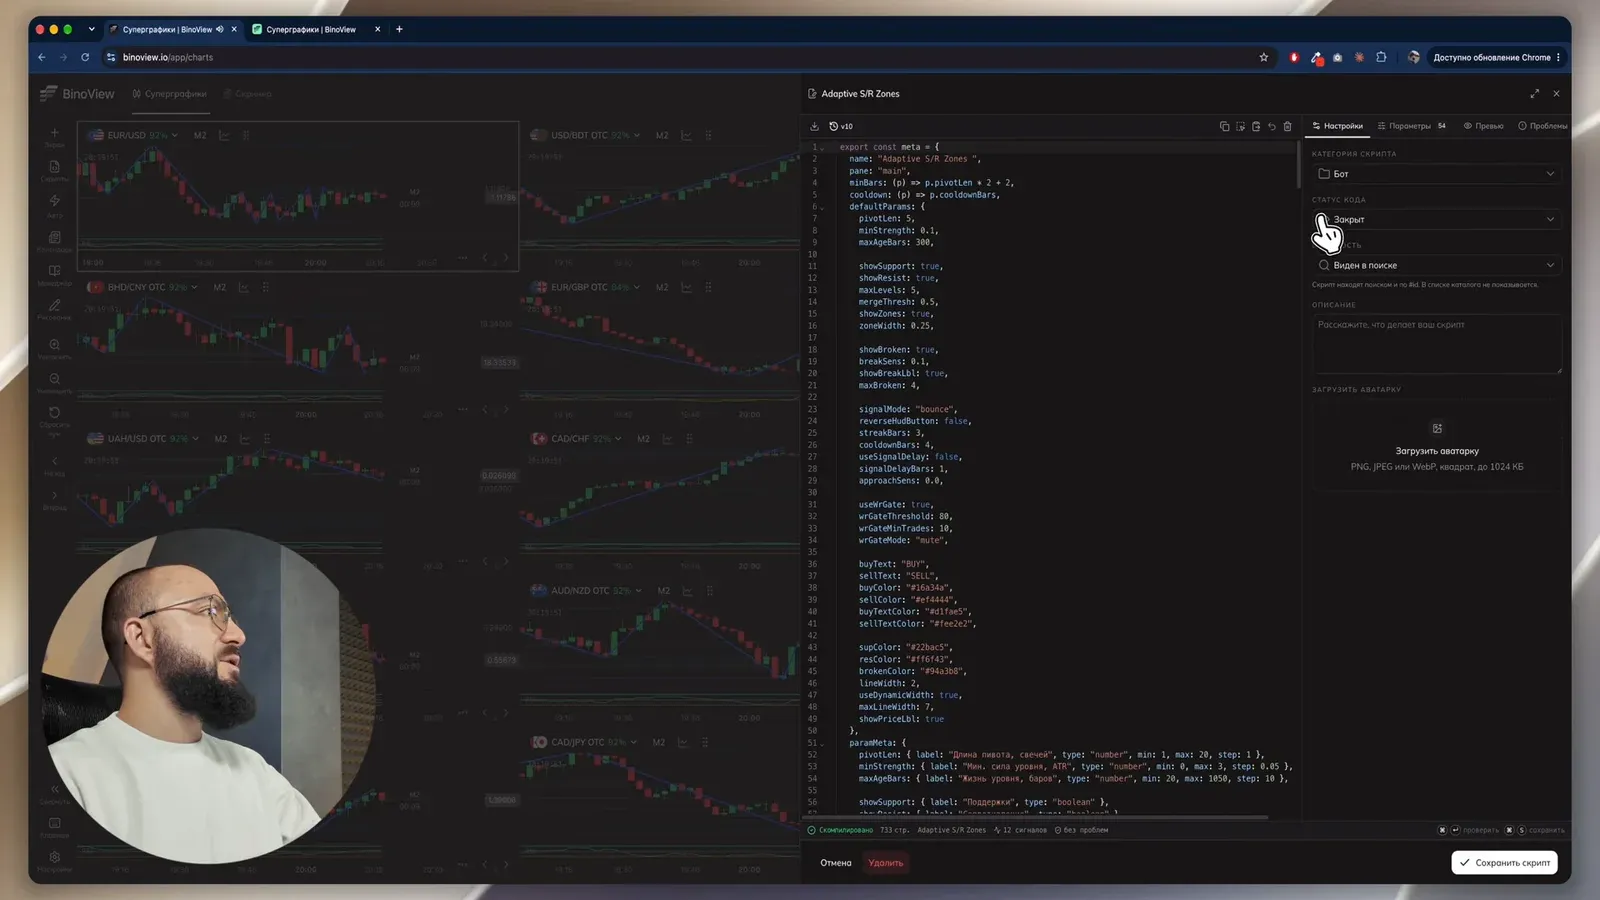
Your own script's settings include:
| Setting | Options |
|---|---|
| Category | bot or indicator |
| Code status | open or closed: a closed script can be used, but its code cannot be viewed or copied |
| Visibility | visible in search (found by name and number, not shown in the general catalog list) or hidden |
| Default parameters | the values the script will have for everyone who adds it to a chart |
| Description and avatar | PNG, JPEG or WebP, a square up to 1,024 KB |
Auto trading: launch settings
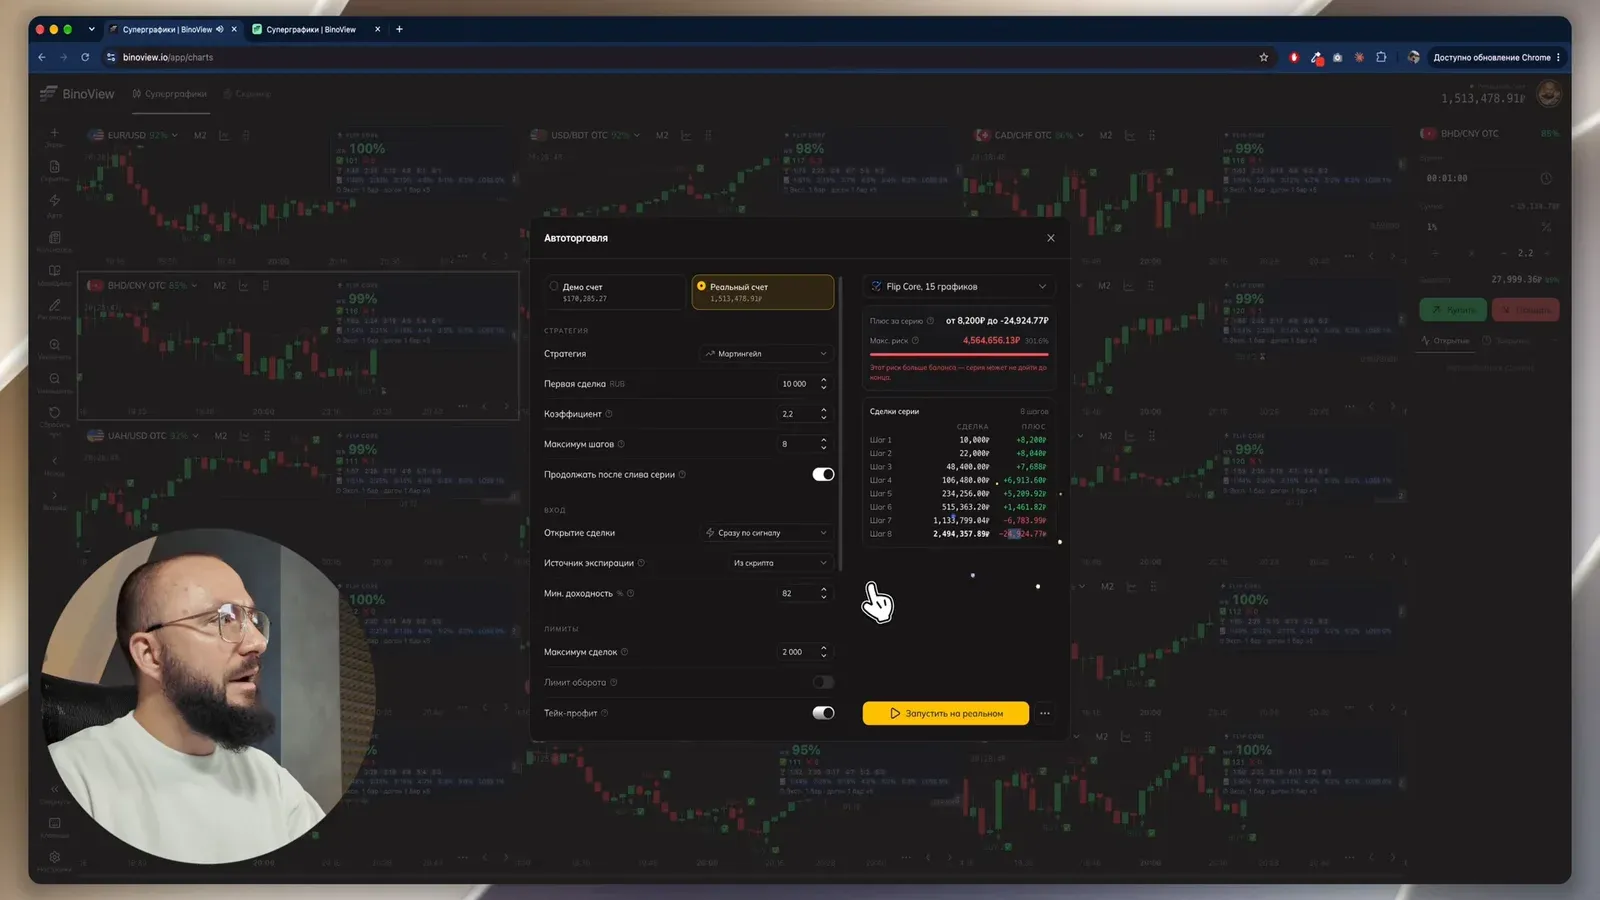
The "Auto" button opens the bot launch. First add the bot to the charts (in the video it is Flip Core on 15 charts), then fill in the window from top to bottom. Only one trading script runs at a time. Every setting has a hint under its question mark icon.
| Setting | What it does |
|---|---|
| Account | demo or real, the real one is highlighted in yellow |
| Script | the bot that will trade |
| Strategy | martingale, free martingale, anti-martingale, recovery trade or fixed amount |
| First trade, coefficient, max steps | series parameters for martingale |
| Continue after a lost series | if every step lost: the bot starts over or stops |
| Trade entry | right on the signal (enters even if the signal later disappears) or on the next candle |
| Expiry source | from the script (the bot's smart mode picks the time and the number of recovery trades) or fixed |
| Min. payout | no trade on assets paying below the threshold |
| Max trades, turnover limit | the bot stops after a set number of trades or turnover |
| Take profit and stop-loss | stop on session profit or loss, with a notification |
| Overlap on the same pair | how many recovery trades the bot makes on one asset |
| Telegram notifications | the result of every series goes to the bot; Pocket Option and BinoDex have separate bots |
| Auto pair switching | replaces a low-paying pair and rotates all pairs on a timer |
Three notes from the video. A fixed 5-second expiry does not suit every asset: the terminal warns "Not all pairs support 5 seconds", and signals on such pairs will be skipped. The trade limit is checked per series, so with martingale the bot may make slightly more trades than set: it carries a series on to the first win. For smart bots the video recommends no more than two overlaps: the bot picks the number of recovery trades itself, usually one to three trades.
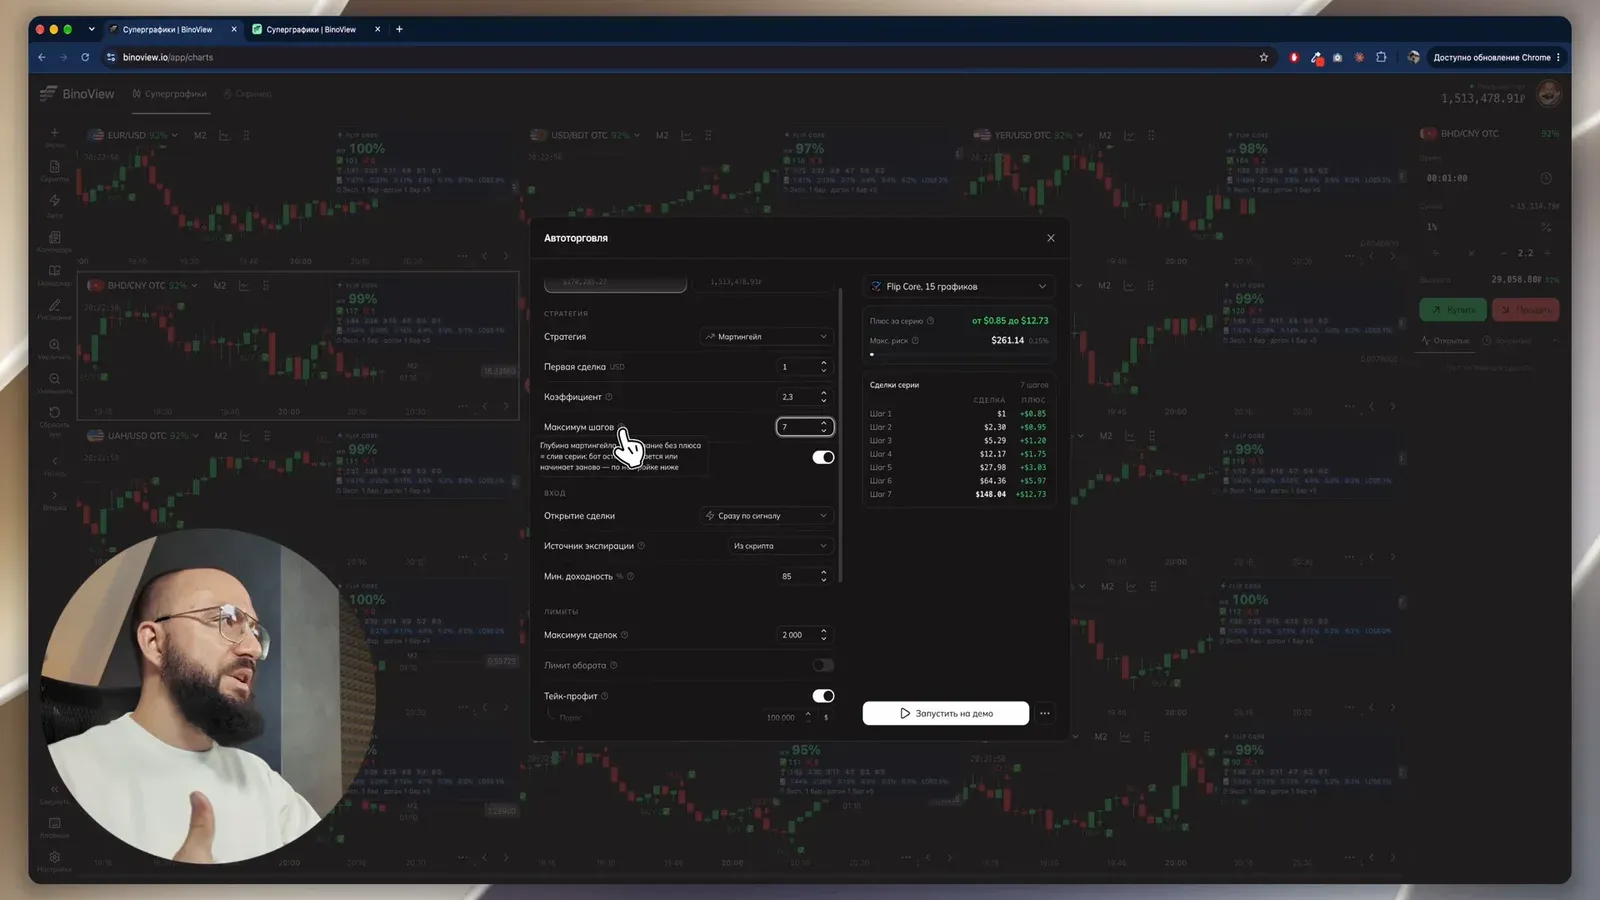
The calculation on the right shows the amount and the profit at every step of the series, plus the maximum risk. In the demo frame, martingale $1 × 2.3 over seven steps at a minimum payout of 85% earns from $0.85 to $12.73 per series and risks $261.14. Check this block before the launch button, not after.
The second example shows why it matters. On the real account the settings are 10,000 ₽ × 2.2 over eight steps at a minimum payout of 82%. The profit per series shrinks with every step, becomes −6,783.99 ₽ at step seven and −24,924.77 ₽ at step eight. The cause is the coefficient: at an 82% payout a step needs a multiplier of at least 1 + 1/0.82 ≈ 2.22, while 2.2 is set. The maximum risk is 4,564,656.13 ₽, 301.6% of the balance, and the terminal says in red: "This risk exceeds the balance — the series may not reach the end." You can check your own series in advance with the martingale calculator.
While the bot is running
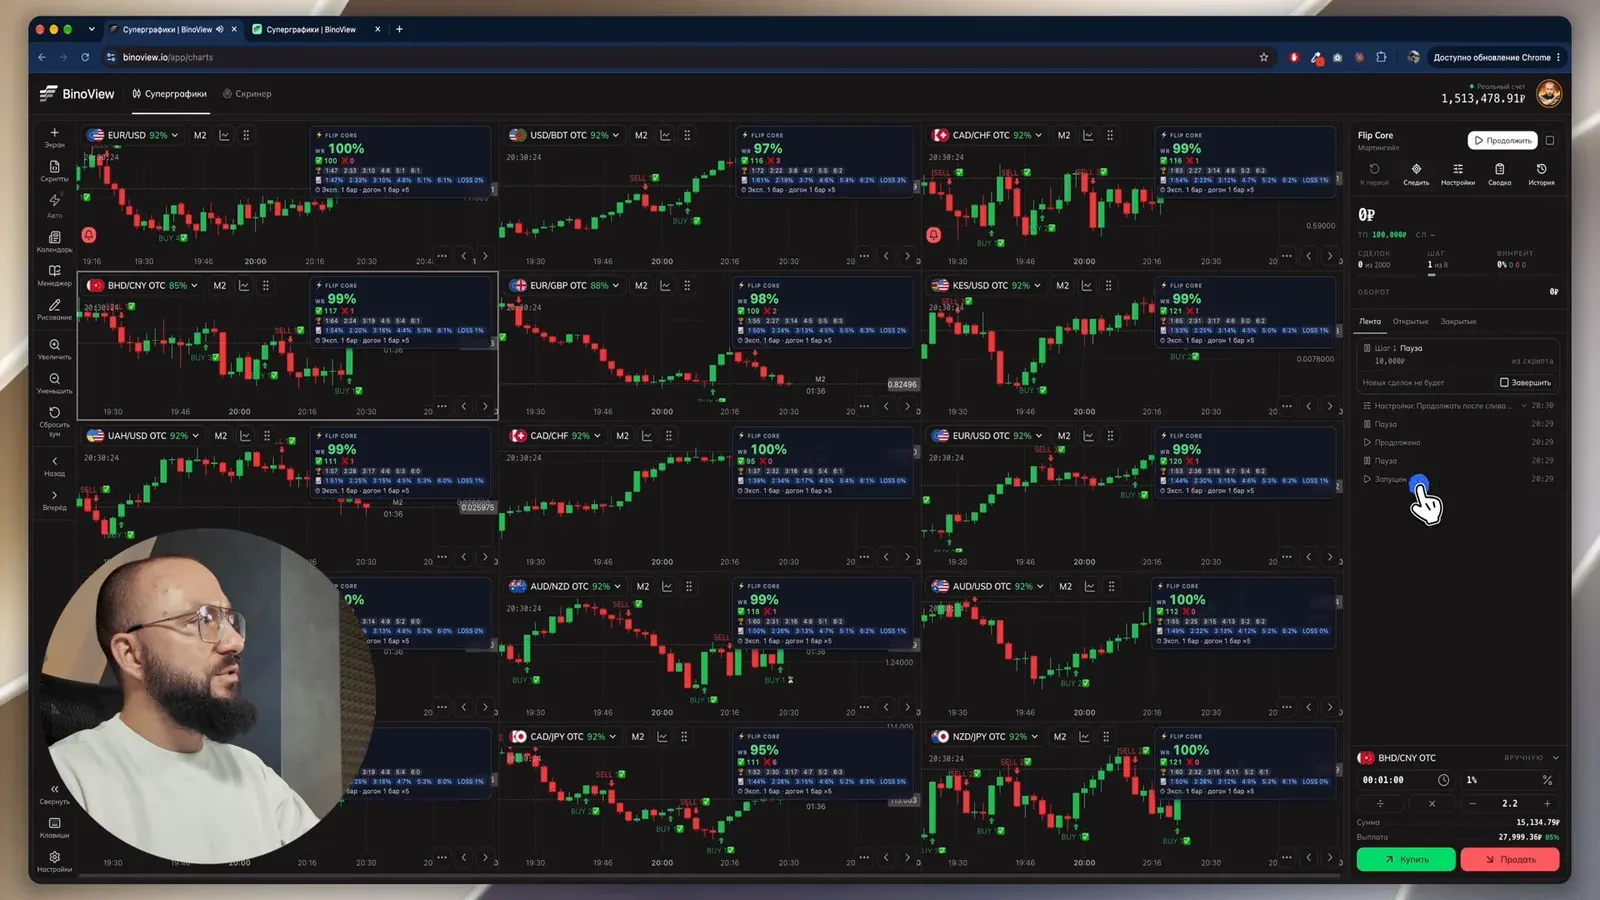
After launch a bot panel appears on the right with these buttons:
- Pause and Resume: the bot stops opening new trades and then picks up again.
- Finish: stops auto trading completely, after a confirmation.
- To first: resets the series to the starting amount.
- Follow: the screen switches by itself to the chart with the open trade. If the icon is crossed out, there is no switching. It works best in sidebar mode.
- Settings: edits on the fly. You can change the amount, the coefficient, max steps, the limits and the toggles. Trade entry and the expiry source are locked: to change them, finish the bot.
- Summary: all launch settings in one list.
- History: past runs.
Every action goes to the run log: launch, pause, resume, changed settings. If something was changed by accident, you see it at once.
Auto trading history and statistics
In the history, open any session: bot, strategy, account type, duration, number of trades, wins and losses, result, turnover, balance before and after. Below are all series step by step. The three dots let you export the session as an image (save or copy) or delete it, for example a test one.
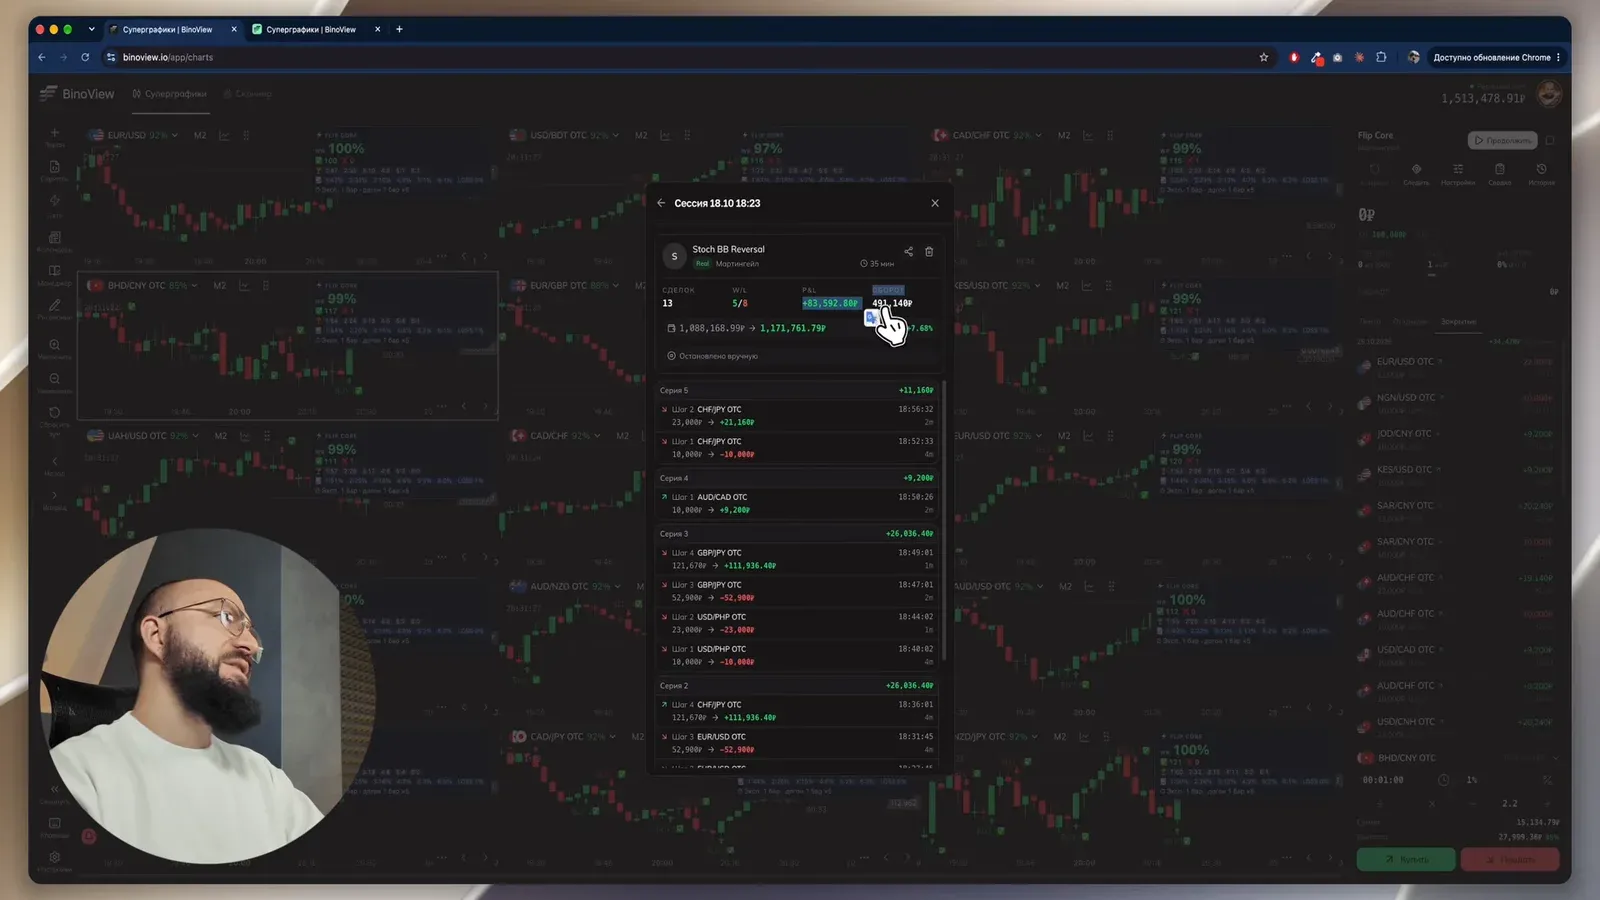
The frame shows how a martingale result is built: in the third series the first three trades lost, and the win came only at step four with a 121,670 ₽ trade, against a first trade of 10,000 ₽.
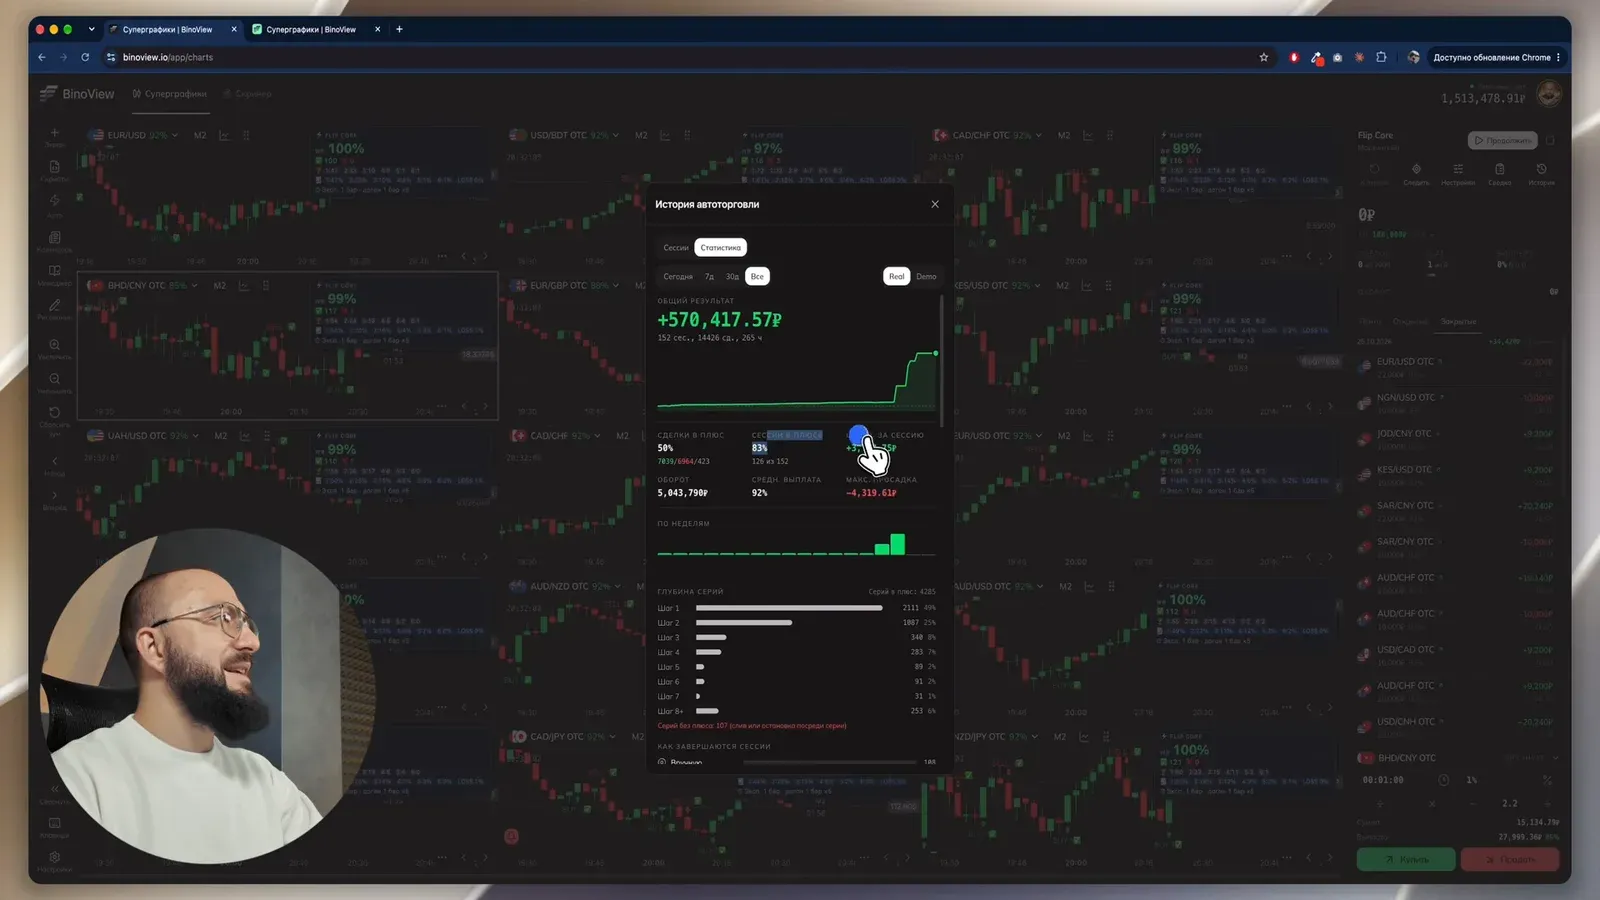
The Statistics tab collects all runs for today, 7 days, 30 days or all time: overall result, share of winning trades and sessions, turnover, average payout, maximum drawdown, and a breakdown by bots and pairs (the most and least profitable). The most useful block is series depth: the step at which series closed. In the frame almost half of all series closed at step one, while 6% reached step eight or beyond. A separate line lists 107 series with no win: a lost series or a stop in the middle of one.
Calendar, manager and drawing
- Calendar is an economic calendar. Pick the day, the importance (high, medium) and the currencies: for example, only US news if you trade dollar pairs. Each event shows the time, impact, forecast and previous value. Past events can be hidden. It is better to pause trading before major news.
- Manager is the trade manager for manual trading: it suggests the next trade amount for the chosen strategy and calculates the balance it requires. All trades of the session are written to the trading journal automatically. A comment is added to a trade with the "Edit" button, and to a whole session via the three dots in closed sessions. Details in the trade manager review.
- Drawing puts lines and shapes on the chart: color, thickness, and one button to delete all drawings. For markup, expand the chart to full screen.
Terminal settings
The "Settings" button sits at the bottom of the left menu. There are three tabs:
| Tab | Setting | What it does |
|---|---|---|
| Market | market type, categories, payout from | which assets appear on all charts |
| Market | unique pairs | assets on the charts do not repeat |
| Market | treat as low below | a pair paying below the threshold is marked "low payout" and gives no sound signals |
| Market | switch to a higher-paying pair, rotate all pairs on a timer | the same as in auto trading, but for manual work |
| Terminal | mass actions | "Back/Forward", timeframes, zoom and scripts apply to all charts at once |
| Terminal | trade size limit | a trade above the limit cannot be opened |
| Terminal | multiplier buttons in the panel, hotkeys | turn on the buttons under the amount and keyboard control |
| Terminal | display mode | grid, mobile or sidebar |
| Terminal | manual zoom, default zoom | remember a chart's zoom; large, medium or small default |
| Terminal | smooth animation, grid, candle timer | smooth price movement or every raw tick, a grid background, a countdown to candle close |
| Terminal | candle color | TradingView, soft, monochrome or custom |
| Sound | script signals, trades, auto trading status, interface | signal sound, trade open and close sounds (standard or Pocket Option style), bot events, button clicks and volume |
The trade size limit is a simple safeguard against mistakes and tilt. In the video the limit is 1,000 ₽: an attempt to buy for 20,000 ₽ gets a message that the amount exceeds the set limit, and the trade is not opened. How to choose such a threshold is covered in the article on the daily loss limit.
Hotkeys
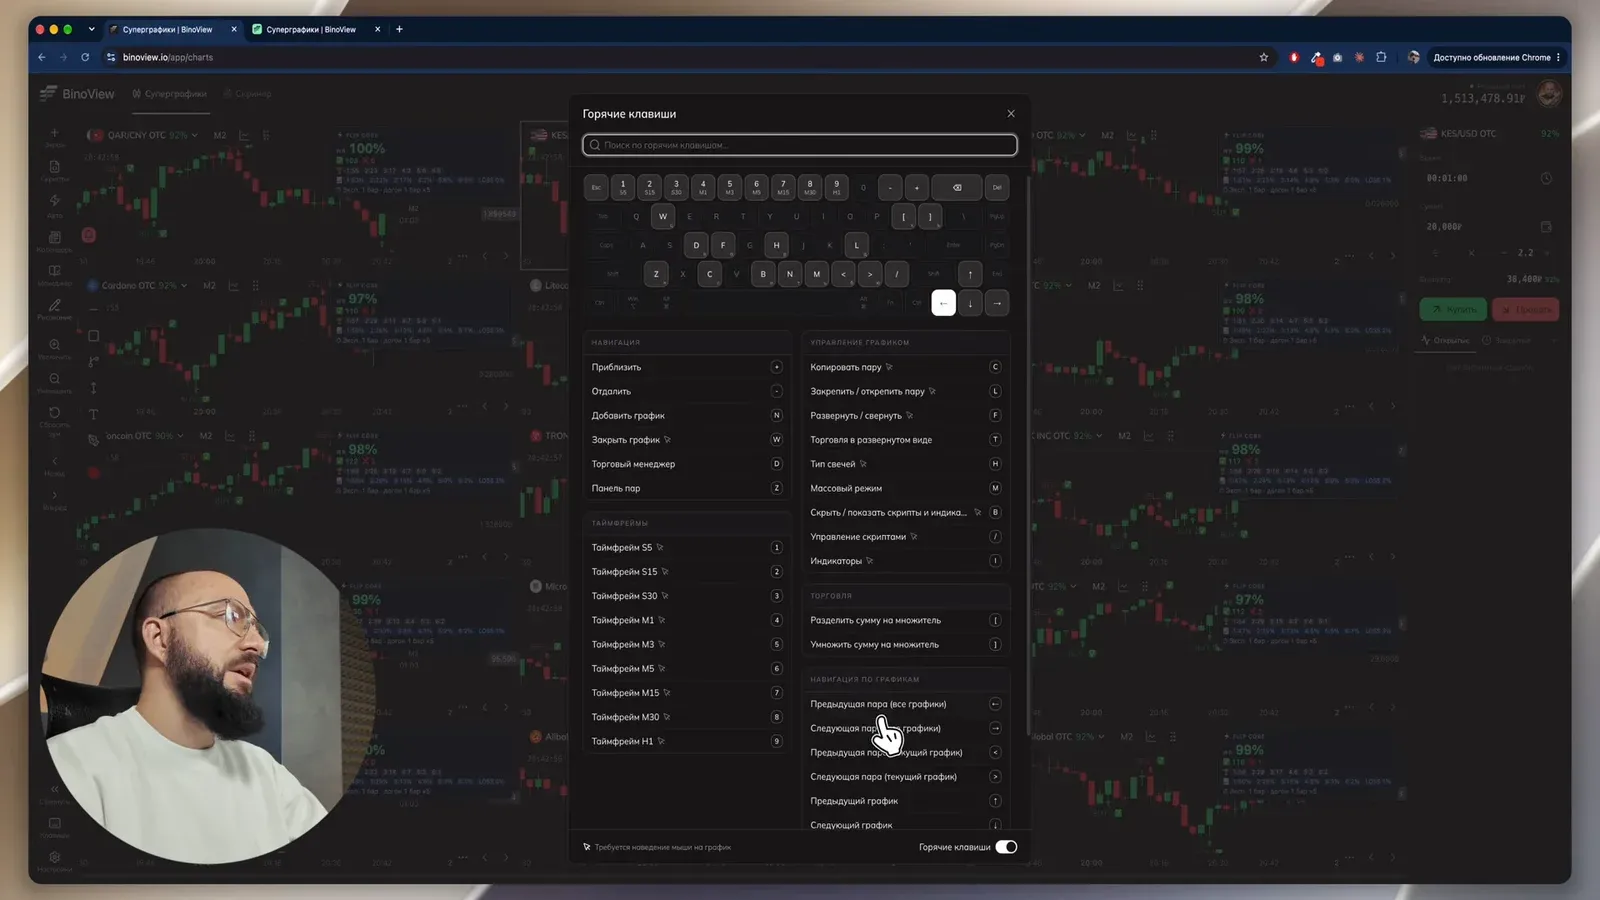
The "Keys" button in the left menu shows the full list with a search box. Keys marked with a cursor icon act on the chart under the mouse pointer.
| Key | Action |
|---|---|
| N, W | add and close a chart |
| + and − | zoom in and out |
| 1–9 | timeframe: S5, S15, S30, M1, M3, M5, M15, M30, H1 |
| C, L, F | copy pair, pin or unpin, expand or collapse |
| T | trading in expanded view |
| H | candle type |
| M | mass mode |
| B | hide or show scripts and indicators |
| I and / | indicators and script management |
| and | divide and multiply the amount by the multiplier |
| D, Z | trade manager, pairs panel |
| ← and → | previous and next pair on all charts |
| < and > | previous and next pair on the current chart |
| ↑ and ↓ | previous and next chart |
Display modes, flags and pinning
The display mode changes the whole terminal:
- Grid: all charts visible at once, up to 15 on screen.
- Mobile: a minimal phone-like view, with the menu moved to the right.
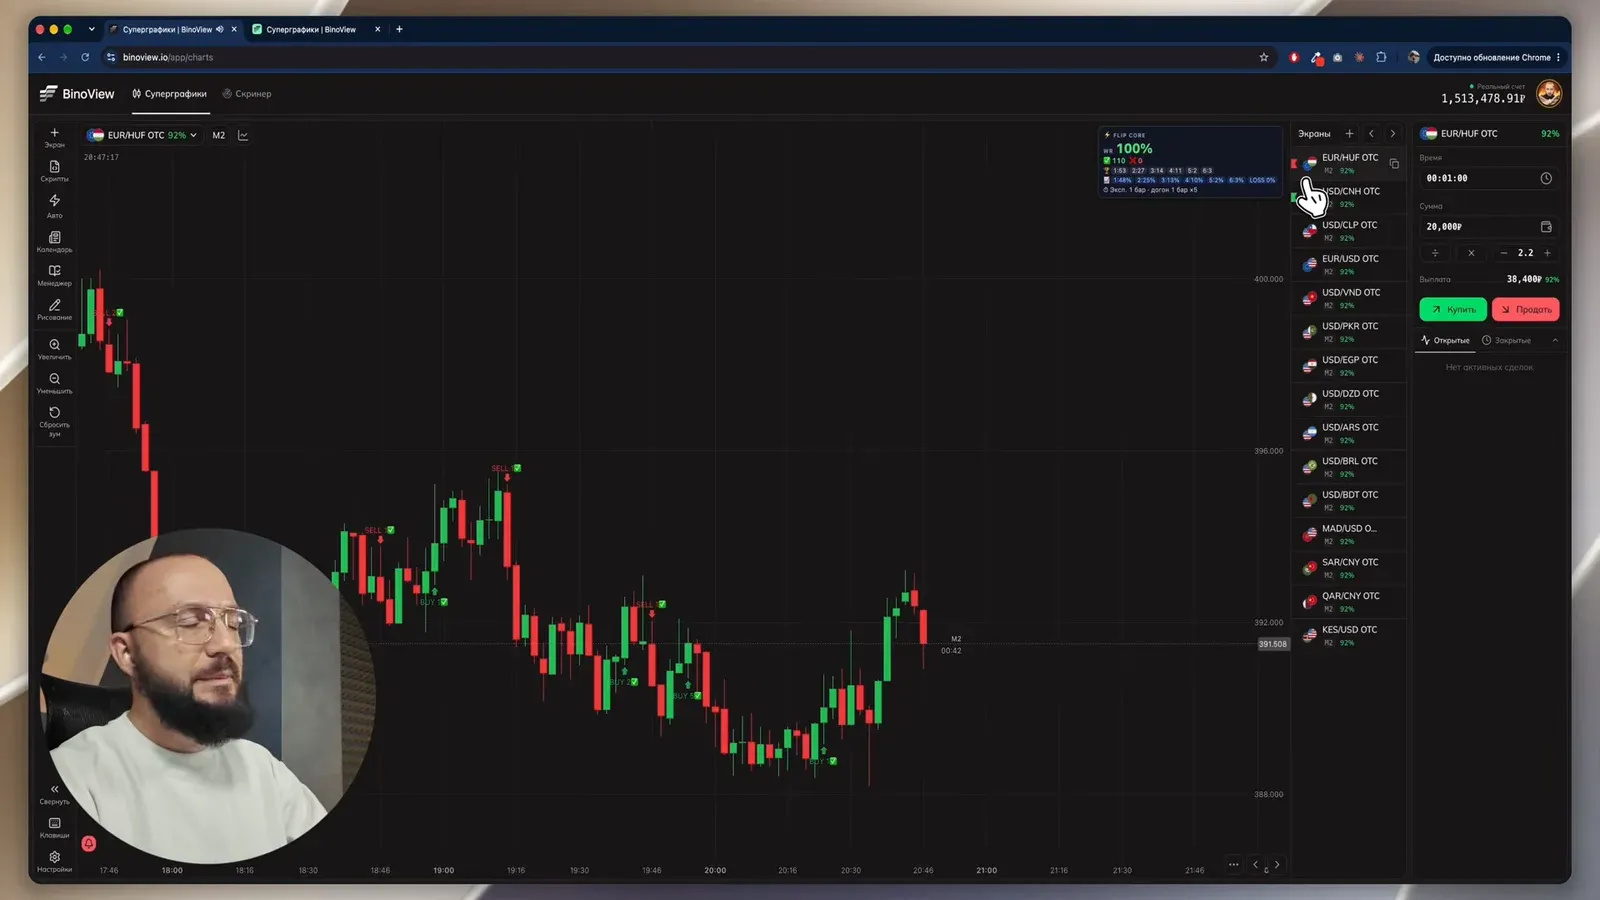
- Sidebar: one large chart with all screens listed on the right. The list switches all at once or one by one, and zoom changes on all charts in sync. With "Follow" turned on, the asset with an open trade is brought to the large chart automatically.
In sidebar mode a right click on an asset sets a colored flag. For example, blue means waiting for a trade, red means a loss just happened here, do not come back, green means a working asset. The flag stays even if the pair moves during mass switching. Assets can be pinned there too: when pairs and timeframes change, pinned ones stay in place.
Screener
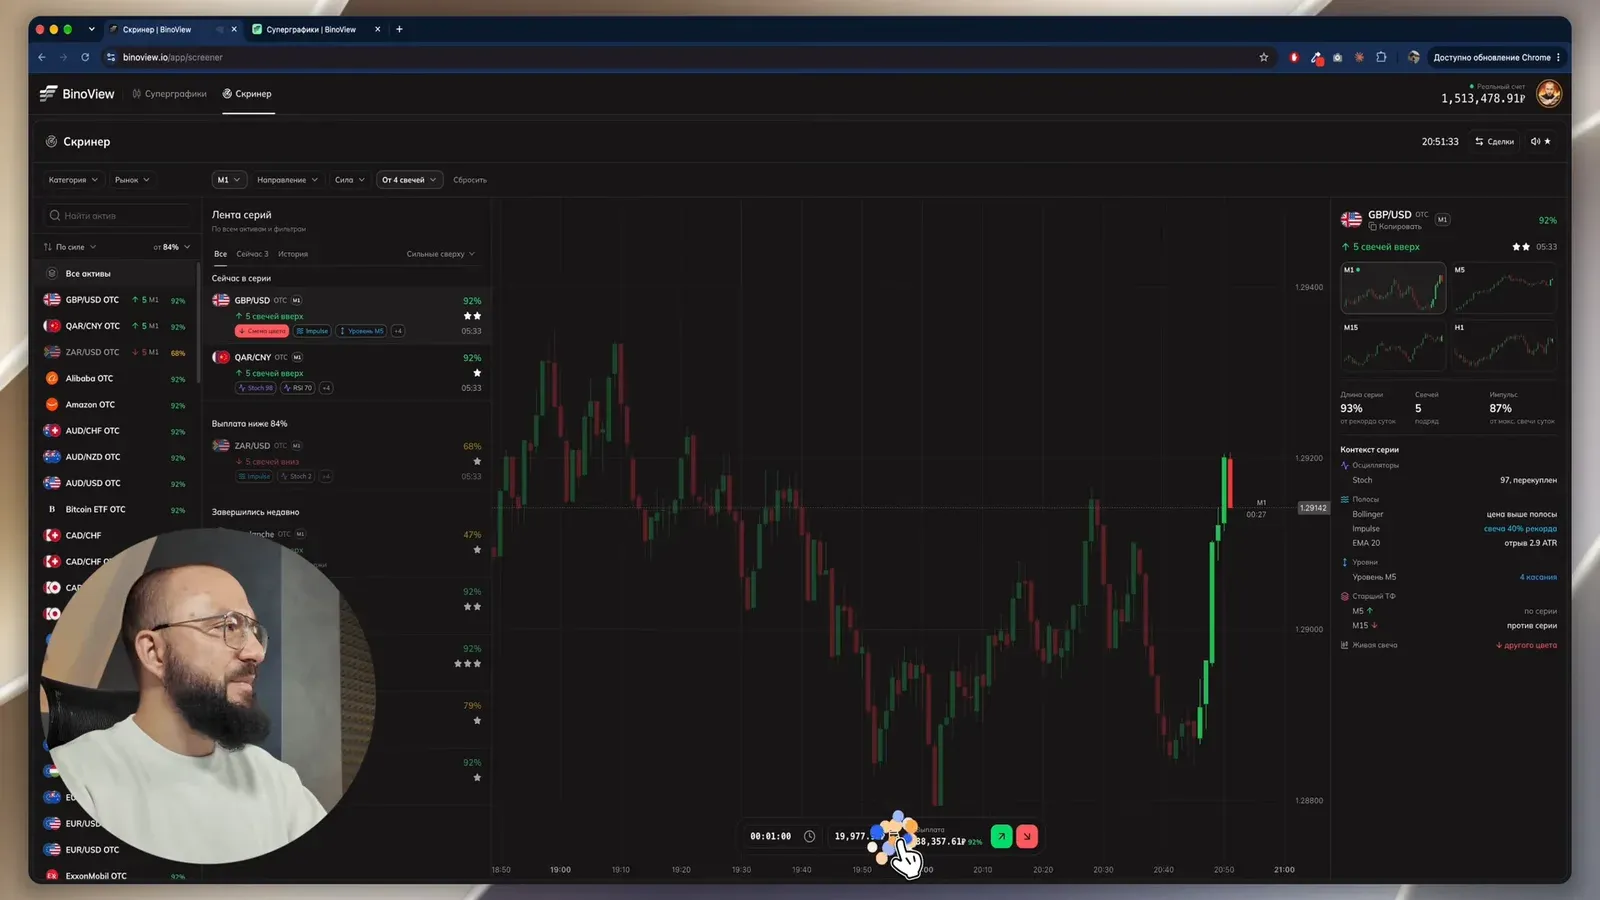
The "Screener" tab in the header looks for streaks of same-color candles across all terminal assets. Filters at the top: category, market, timeframe (M1, M5 or both), direction, strength in stars and streak length from 4, 6, 8 or 10 candles. On the right is sound by stars: for example, a signal only from two stars up. On the left is the asset list, in the middle the streak feed ("In a streak now", "Recently finished"), on the right a summary of the selected asset: streak length, impulse, context from oscillators, bands, levels and the higher timeframe. A trade can be opened right from the screener: time, amount or deposit percentage, and up and down buttons. The screener also works on a smartphone. A detailed walkthrough of the filters is in the sequence screener review.
Frequently asked questions
How is the Pocket Option terminal different from the BinoDex terminal?
Only by the broker and the address. The Pocket Option terminal opens at binoview.io, the BinoDex one at bdex.binoview.io, and each has its own account and its own list of assets and payouts. Supercharts, scripts, auto trading, the trade manager and the screener work the same way, so everything in this guide applies to both addresses.
Which auto trading settings cannot be changed without stopping the bot?
Two: trade entry (right on the signal or on the next candle) and the expiry source (from the script or fixed). To change them, finish the bot and launch it again. The first trade amount, the coefficient, the maximum number of steps, the limits and the toggles can all be changed while the bot is running, and every change is written to the run log.
Why does the martingale calculation show the profit per series shrinking and turning negative?
Because the coefficient is lower than the one the chosen payout requires. For a martingale step to cover all previous losses, the coefficient must be at least 1 + 1/payout: at an 82% payout that is about 2.22. With a coefficient of 2.2 the profit per series melts with every step and turns into a loss at step seven. Raise the minimum payout to 84% and the threshold drops to 2.19, so all steps stay positive.
Author
Nick
Runs the «Много денег» YouTube channel, editor of the Academy BinoView blog.